Minitab Error - * ERROR * Unbalanced Design - Unbalanced Anova

J

jhbalaji

I was going through this tutorial

I don't know whats wrong i followed the same command line as said by the professor but still i am getting as

* ERROR * Unbalanced design. A cross tabulation of your factors will show
* where the unbalance exists.
Can someone please help me on this?
I am new to minitab and anova!

Thanks!
 

Attachments

  • elsalinity.zip
    1.5 KB · Views: 139
Last edited by a moderator:

Miner

Forum Moderator
Leader
Admin
Re: Unbalanced Anova

I moved this thread to the Minitab software sub-forum.

Can you attach your Minitab project file? You will have to zip it first before attaching it. This would make it easier to tell where you went wrong.

Unbalanced means that the number of results per experimental run is not equal. Either the data file was in error, or you are using the wrong routine in Minitab.
 
J

jhbalaji

Re: Unbalanced Anova

I have done it
Its the same file available in the tutorial site!


Thanks!
 
Last edited by a moderator:
B

Barbara B

Re: Unbalanced Anova

I have done it.
You've attached a Minitab worksheet (elsalinity.MTW), not a Minitab project (file ending .MPJ).

Could you please attach the Minitab project so we could take a look at the steps you've done so far? Thanks :)
 

Miner

Forum Moderator
Leader
Admin
The data file is fine, so we need to see how you approached the analysis to determine how you arrived at this error message.
 
J

jhbalaji

The data file is fine, so we need to see how you approached the analysis to determine how you arrived at this error message.

I used the MiniTab command line

MTB > ANOVA c4 = c1 c2 c3 c1*c2 c1*c3 c2*c3 c1*c2*c3;
SBC> Means c1 c2 c1*c2 c1*c2*c3.

Its showed me unbalanced error!
Balanced ANOVA approach i tried!
 
B

Barbara B

Maybe someone copied the wrong command (ANOVA instead of GLM) or copied only a part of the data into the worksheet. This is no balanced ANOVA.

In a balanced design every combination of factors has the same count. In your worksheet TEMP (c1) and SALINITY (c2) as well as TEMP and DENSITY (c3) are unbalanced, see attached crosstabs screenshot. There are different counts e.g. for Temp=1 and Salinity=2 (count: 6) and Temp=1 and Salinity=3 (count: 4).

If you want to analyze this data with an ANOVA, use GLM instead of balanced ANOVA:
Code:
GLM c4 = c1 c2 c3 c1*c2 c1*c3 c2*c3 c1*c2*c3;
SUBC> Means c1 c2 c1*c2 c1*c2*c3.

or

Stat > ANOVA > General Linear Model
response: GAIN
model: TEMP SALINITY DENSITY TEMP*SALINITY TEMP*DENSITY SALINITY*DENSITY TEMP*SALINITY*DENSITY
results: Display least squares means corresponding to the terms:
TEMP SALINITY DENSITY TEMP* SALINITY TEMP* DENSITY TEMP* SALINITY* DENSITY
> OK > OK

And please provide the Minitab project file the next time you have a question, because it is much easier to understand what you've done so far.
 

Attachments

  • Minitab Error - * ERROR * Unbalanced Design - Unbalanced Anova
    Crosstabs.png
    6.1 KB · Views: 331
B

Barbara B

Here are some additional informations about balanced and unbalanced designs:
In a balanced design the number of experiments/runs for every treatment and every combination of treatments (interaction) is the same, see NIST handbook: 5.7 A Glossary of DOE Terminology and 1.3.5.5 Multi-factor Analysis of Variance.

To check whether a data set contains a balanced design you can use crosstabs or barcharts with the number of observations/runs for each treatment level and combination of treatment levels. If each cell (=1 bar in a bar chart) has the same count in all tables/on all graphs, the data is balanced.

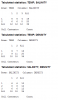
Separate tables for single treatments:
Stat > Tables > Tally individual Variables
(e.g. Variables: TEMP)

Crosstabs in Minitab:
Stat > Tables > Cross Tabulation and Chi-Square
(e.g. Categorical variables: for rows: TEMP, for columns: SALINITY)

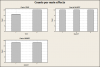
Separate bar charts for main effects / single treatments
Graph > Bar Chart > Simple
(e.g. Categorical variables: TEMP)

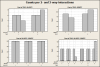
Bar Chart for treatment combinations / interactions:
Graph > Bar Chart > Cluster
(e.g. Categorical variables: TEMP SALINITY)

In the elsalinity.mtw data the bars do NOT show equal cell counts, not for the main effect TEMP neither for the 2- and 3-way interactions of TEMP*SALINITY, TEMP*DENSITY and TEMP*SALINITY*DENSITY. Salinity, density and the 2-way interaction salinity*density are balanced with a cell count of 12, 16 and 5, resp., see attachments.

To analyze an unbalanced design you can use one of the following menus in Minitab:
  • general linear model GLM:
    Stat > ANOVA > general linear model
  • general regression GREG:
    Stat > ANOVA > general regression (available since Minitab R16, specify the categorical factors as categorical)
  • general full factorial DoE:
    1. Define worksheet as general full factorial DOE-design: Stat > DOE > Factorial > Define Custom Factorial Design
    2. Analyze the design: Stat > DOE > Factorial > Analyze Factorial Design
All those Minitab menus provide the same results for a balanced and unbalanced ANOVA, because the math behind is the same (even if the names and menus differ).
 

Attachments

  • Minitab Error - * ERROR * Unbalanced Design - Unbalanced Anova
    Counts per Main Effects.png
    2.5 KB · Views: 286
  • Minitab Error - * ERROR * Unbalanced Design - Unbalanced Anova
    Counts per 2- and 3-way Interactions.png
    4.9 KB · Views: 368

Miner

Forum Moderator
Leader
Admin
All those Minitab menus provide the same results for a balanced and unbalanced ANOVA, because the math behind is the same (even if the names and menus differ).

The same mathematical results in the Session Window, but there are typically some graphical outputs available with one, but not the other.
 
Top Bottom