Gage Bias and Linearity - How to interpret the Minitab results

T

TheCableGuy1

Our company manufactures cable assemblies. As such we do preliminary testing in our electrical lab and when qualified move to a separate tester to do our production testing. We are required to demonstrate that the lab data and the tester data correlate.

To this end I have decided to use a Gage Linearity and Bias test, with the lab data being the reference. The lab data is taken twice and averaged to account for some variation in testing. The tester data is then taken three times to give (hopefully) enough samples.

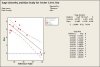
I have attached an image of what Minitab gives me back. Several of the measurements have low bias and almost no linearity. The difficulty I am having comes from when i have very low P-values but high bias. Bias is ok, as we do expect there to be some difference in the test methods and these can be adjusted for in the pass/fail criteria.

Any help in deciphering what it means to have a large bias value when the P-value is very small would be appreciated.
 

Attachments

  • minitab_capture.JPG
    minitab_capture.JPG
    31.6 KB · Views: 747
B

Barbara B

The bias value itself gives you the information about the difference between reference value and measurement. The p-value provides information about the significance of the bias value answering the question "Is there a significant differenc between reference and bias value or occured this difference simply by chance?"

Bias: Difference between reference value and (averaged) measurement
p-value: probability for getting a specific bias (e.g. average bias = 5.17) or a more extreme bias if the assumption H0 is true
null hypothesis H0: There is no bias / bias = 0 (-> alternative H1: bias <0 or >0)

Meaning:
p=0.43 >0.05(=alpha): keep H0 -> bias=0 / no significant bias in the data
p=0.02 <0.05(=alpha): reject H0 -> bias <0 or >0 / significant bias in the data

Regards,

Barbara
 
T

TheCableGuy1

Thanks for the reply. In the example that I attached I was having a hard time interpreting the results because the Bias p-Value is listed by Minitab as * .

So the way I have interpreted the data at this point is that there is a statistically signifcant slope to the data because the slope p-value is less than .05. This indicates that there is statistically significant linearity.

However since no p-value is listed for the bias I must assume that the average bias cannot be "trusted" as the slope it too severe for the bias to have any meaning.

In our system a "flat" bias is acceptable because we can adjust our pass/fail criteria to account for the different way the testing is done. In the included example it seems that I can draw no conclusions about how the pass/fail criteria can be adjusted because the bias generated by this method cannot be trusted as accurate across the entire measurement range.

I feel like I may be taking the interpretation a bit too far there, but I don't know what other information or details i need to make that assumption.

Bottom line is: Need to find bias and adjust for bias in test limits. Trying to find out if this test will allow that. In some cases it seems to, but in the included case I am not so sure.
 

Miner

Forum Moderator
Leader
Admin
In order for Minitab to calculate a p-value at each reference level, you must have multiple measurements. It is difficult to tell from the graph only, but it appears that you have a single measurement for each reference value.
 
B

Barbara B

To get a clearer picture about the results achieved with Minitab linearity study it would be very helpful to see your data. As you've written in your first posting, the tester data was taken three times, but the output doesn't give you the p-values for each reference value as there are 10 reference values (=10 bias values calculated) but only 12 points in the graph.

Could you please post your data? (You cannot attach it because your posting number is less than 4.)

Thanks,

Barbara
 
E

eturkan

For a larger permissible bias you need a high standard deviation. But it is limited to repeatability requirement. Minitab does not check for this and you can come up with a reverse max bias calculator for USL-LSL, 6 Sigma, P, and Repeatability% requirement.

I too agree that you may not have enough data for each reference value.

Can someone tell me if you have bias / you can not correct it due to material deformation and next level measurement system is expensive, what should be the next action?

My problem is deviation in the bias study is so low (repeatability is less than %5 and bias is always negative.For a good bias results, you need individual positive and negative bias values so that they diminish each other. Deviation is also a MUST


Thanks
 
Top Bottom