B
Bjourne
I just am trying to study 7 QC Tools and I started off with Histogram and then Control Charts(variable data first). As I was finished with computing manually the data I have I checked it out with an officemate via JMP 7. I had different results mainly because my spread is not the same as that of JMP 7's....
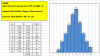
Please see the image of my data table below.
No of observations = 75
Max = 2.15 Min = 1.70
Range = Max - Min = .45
Class Interval = square root of 75 = 8.6602 = 9
STDEV = .099742912
Internal Class Width = STDEV / 3 = .099742912 / 3 = .03
Please see my tally sheet and histogram below.
Here is the JMP 7 image my officemate created. (I do not know how to use JMP 7 by the way") ...)
...)
Please allow me some beginner questions..
As the image shows, JMP 7's is different than mine. I have 10 bars the same as JMP but the distance of the data "0" is not the same.
Is my histogram wrong?
What's the rule of the thumb for the "internal class width"...? Is it:
(1) STDEV / 3 which is the Standard Deviation divided by 3
or
(2) Internal Class Width = Range / Class Interval....? Where if I will use my data above, my class interval is the square root of 75 rounded to "0", which is 9. So if I apply the formula mentioned, .45 / 9 = .05
Please see image below if I use (2).
When will I use (1)...?
When will I use (2)...?
I also saw this at the moresteam_com website about histograms,
There are two options given there, (A) and (B). If I use (A) in determining the number of class intervals, am I to use (A) also in determining the internal class width..?
If I use (B) in determining the number of class intervals then also in determining the internal class width..?
This is getting confusing to me because I am a beginner and just trying to learn stuff that I can apply at work.
One officemate handed me an old training sheet she had which has a table for determining Class Interval. Please see below.
The number of observations I have is 75. If I use the table above, what will I use as CI...? It says there 6 to 10...
It also says there,
So if I use that,
CI = .45 / (1+0507855872)
CI = .45 / 1.507855872
CI = .298437011
CI = .298
CI= .30
Width = Range/# Intervals = .44 / .30 = 1.5
I do not know what is the correct formula to use now.....?
Please help...and I beg for your consideration as I really am a beginner. Thanks for understanding gurus
Please see the image of my data table below.
No of observations = 75
Max = 2.15 Min = 1.70
Range = Max - Min = .45
Class Interval = square root of 75 = 8.6602 = 9
STDEV = .099742912
Internal Class Width = STDEV / 3 = .099742912 / 3 = .03
Please see my tally sheet and histogram below.
Here is the JMP 7 image my officemate created. (I do not know how to use JMP 7 by the way
...)Please allow me some beginner questions..
As the image shows, JMP 7's is different than mine. I have 10 bars the same as JMP but the distance of the data "0" is not the same.
Is my histogram wrong?
What's the rule of the thumb for the "internal class width"...? Is it:
(1) STDEV / 3 which is the Standard Deviation divided by 3
or
(2) Internal Class Width = Range / Class Interval....? Where if I will use my data above, my class interval is the square root of 75 rounded to "0", which is 9. So if I apply the formula mentioned, .45 / 9 = .05
Please see image below if I use (2).
When will I use (1)...?
When will I use (2)...?
I also saw this at the moresteam_com website about histograms,
1. Count the number of data points (50 in our height example).
2. Determine the range of the sample - the difference between the highest and lowest values (73.1-65, or 8.1 inches in our height example.
3. Determine the number of class intervals.
You can use either of two methods as general guidelines in determining the number of intervals:
A. Use ten intervals as a rule of thumb.
B. Calculate the square root of the number of data points and round to the nearest whole number. In the case of our height example, the square root of 50 is 7.07, or 7 when rounded. You may wish to experiment with different interval numbers. If there are too many, the distribution will spread out, and the histogram will look flat. Likewise, if there are too few intervals, the distribution can look artificially tight.
4. Determine the interval class width by one of two methods:
A. Width = Range/# Intervals = 8.1 / 10 = 0.81
B. Divide the Standard Deviation by three. In this case, the height data has a Standard Deviation of 1.85, which yields a class interval size of 0.62 inches, and therefore a total of 14 class intervals (Range of 8.1 divided by 0.62, rounded up).
This is slightly more class intervals than our rule of thumb indicated....
There are two options given there, (A) and (B). If I use (A) in determining the number of class intervals, am I to use (A) also in determining the internal class width..?
If I use (B) in determining the number of class intervals then also in determining the internal class width..?
This is getting confusing to me because I am a beginner and just trying to learn stuff that I can apply at work.
One officemate handed me an old training sheet she had which has a table for determining Class Interval. Please see below.
The number of observations I have is 75. If I use the table above, what will I use as CI...? It says there 6 to 10...
It also says there,
Alternatively: Cell interval = Range / (1+3.22Logn)
So if I use that,
CI = .45 / (1+0507855872)
CI = .45 / 1.507855872
CI = .298437011
CI = .298
CI= .30
Width = Range/# Intervals = .44 / .30 = 1.5
I do not know what is the correct formula to use now.....?
Please help...and I beg for your consideration as I really am a beginner. Thanks for understanding gurus