Are the standard measurement system requirements too demanding?

Semoi

Involved In Discussions
Hi,
in this forum I found a reference to Wheeler's publication "How to establish Manufacturing Specifications". He publishes a series in which he discusses the following measurement model:
yMeas = yTrue + epsilon,
where
yTrue~N(mean=0, sd=1)
is the true (but unknown) value,
epsilon~N(0, sigma_e)
is a random measurement error and yMeas is the result of the measurement. What is special about this series is that he "assumes" that yMeas and yTrue are correlated. Thus, even if we measure a value yMeas, which is on the specification boundary, we can be pretty sure that the true value yTrue is within the specification. The graph looks as follows:
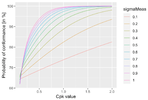
Bildschirmfoto 2023-06-09 um 20.43.12.png
The key to understand this behaviour is that the mean value of yTrue is well within the specification. Therefore, if we obtain a measurement on (or close to) the specification boundary, we have a high probably that this is merely a measurement error -- in particular, if the Cpk is above 1.
Wheeler concludes that if the production process is in statistical control, the standard (AIAG, Minitab etc.) requirements for the measurement system are over conservative.

I am working in the medical device manufacturing industry, and I doubt that I will be able to implement Wheeler's logic soon -- our manufacturing processes are not stable enough, yet. However, if you have implemented Wheeler's methods, I am interested in reading how it went. Was it a success, or did you overlook something? Also, if you have not implemented it, I am interested in reading your arguments. Have you relaxed the requirements for the measurement devices?

Thanks!
 

Bev D

Heretical Statistician
Leader
Super Moderator
Well since no one else has responded I will. My organizations have used this method. With some slight differences. I use capability but not Cpk (nor it’s flawed reliance on the Normal distribution and conflating of process spread with defect rate). A simple control chart will tell you if the process is stable and simple raw data time series graph (multi-vari) will tell you if a process is capable. After assuring that measurement error isn’t too large or by guardbanding) The R&R method proposed by AIAG (I believe it was developed by someone at GM…) and implemented by MINITAB and JMP, etc. overstate the measurement error because of the flawed math of dividing the measurement error SD by the tolerance range.
My organizations have implemented the alternative mathematically correct approach fro measurement error, use SPC to determine stability and drive our processes to capability. It works quite well.

Of course as Miner points out if you use the AIAG method and you have <10% error to tolerance range AND you are stable and capable (Cpk >1.33) you will be fine too as these are very conservative methods…
 

Miner

Forum Moderator
Leader
Admin
I agree with @Bev D that the AIAG methods are very conservative and that Dr. Wheeler's methods are better WHEN you have the freedom to adopt them. Unfortunately, most people visiting this forum are required to use the AIAG methods, which is why I focus on them. They do work but may reject otherwise useful gages.

Regarding your comment about a measurement at or near the spec limit being in-spec, I would be cautious. It would be true in a very specific circumstance. Namely, the capability must be marginal AND the process must be in control. If the process is more capable and centered, the only way that you could have a point at or near the spec limit would be if the process were out-of-control, in which case, Wheeler's argument would NOT APPLY. This means that there is equal probability that the true value is out of spec. Or, if the process is not capable, it would not apply either.
 

Miner

Forum Moderator
Leader
Admin
It's expensive, but you can also take multiple measurements and average them. You reduce the measurement variation by the square root of the sample size.
 

Semoi

Involved In Discussions
@Bev D: May I ask in which industry you are working? As you said that your organisation implemented Wheeler's method (with certain changes) I reckon that you are not in the automotive industry. However, this hardly narrows it down ;)

@Miner: As always, the math is only as good as the validity of the assumptions. Therefore, if the process is out of control, we immediately violate the critical assumption that the true values are distributed as N(mean=0, sd=1). Thus, we really have to ensure that the stated model is correct to apply Wheelers arguments. However, if the model is correct and if we have a Cpk of say 1 and the standard deviation of the measurement process of say 0.5, the graph tells us that a part, which is measured to be exactly on the upper specification limit, has a change of being conforming with a probability of approx 90%.
Thus, I feel that increasing the number of measurements and averaging the result counters the key point of Wheelers paper: We don't need a measurement system with a "small" measurement uncertainty to be rather sure that the parts are conforming. If we are able to optimise our machining process, then we need the measurement system only for monitoring. In fact, in the second part of the paper Wheelers shows that a rather "bad" measurement system is sufficient to monitor the machining process -- Wheeler discusses only (!) the XBAR chart and takes a sample size of n=10, which is where your SD/sqrt ( n ) comes into play. We all know that monitoring SD is more demanding, as we not only lack the 1/sqrt ( n ) dependence, but also we are more sensitive to the assumption of the normal distribution.
 
Last edited by a moderator:

Semoi

Involved In Discussions
I don't know why, but my 1/sqrt( n ) produces these weird symbols.

By the way: I feel that the second part of the paper is not really helpful, because if the measurement system has a large variance, we expect to obtain many "false positive" violations of the SPC control rules. Therefore, it is more important if we are able to limit these false positives, and less important if we capture the true positives.
 

Bev D

Heretical Statistician
Leader
Super Moderator
I was most recently in the veterinary diagnostic industry. Manufacturing of diagnostic devices and instruments. Also laboratory testing. I had a lot of autonomy to implement methodologies rather than adhering to regressive ‘standards’. I have worked in automotive, aerospace and semiconductor industries.
Occasionally I was able to get my customer SQEs see the light. Change can only occur when the quality profession grows a spine and fights for better practices. This includes the weany ASQ.
 
Top Bottom