M
michalgajewskix
Hi,
In my company (wind sensors manufactur) we try to introduce a set of tools to control our production and measurement system, problematic issue is the fact that no one knows how to do this correctly… my manager thinks about:
1. Cp, cpk indices and I and MR charts to control company production, how far from spec limits we are, how close to mean, etc.
2. Gage R&R Type 1 to verify a measurement system
I have read a few articles about this topic so far, but still this is not clear for me.Please correct me if I am wrong.
Type 1, because to start a calibration of our product (wind sensor) operator needs to press only a start button (so there are no variation between operators).
For a Gage R&R type 1 I want to use 1 unit and measure it 30 times, in this way I will have information about repeatibility. Can I add also 30 measurements of 30 different units (1 measurement per 1 unit) to get information about reproducibility?
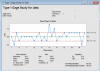
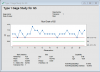
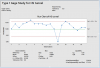
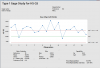
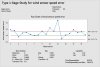
I have problem with my outputs (in the attachments you can see graphs from minitab)
In TunnelDAta.xlsx you could find measurement data in two columns:
First – measurements of 30 units,
Second – 30 measurements of the same unit.
in Gage R&R type 1 I dont see any condition for NDC, can I use data which I used?
Thank you for any help.
Regards
In my company (wind sensors manufactur) we try to introduce a set of tools to control our production and measurement system, problematic issue is the fact that no one knows how to do this correctly… my manager thinks about:
1. Cp, cpk indices and I and MR charts to control company production, how far from spec limits we are, how close to mean, etc.
2. Gage R&R Type 1 to verify a measurement system
I have read a few articles about this topic so far, but still this is not clear for me.Please correct me if I am wrong.
Type 1, because to start a calibration of our product (wind sensor) operator needs to press only a start button (so there are no variation between operators).
For a Gage R&R type 1 I want to use 1 unit and measure it 30 times, in this way I will have information about repeatibility. Can I add also 30 measurements of 30 different units (1 measurement per 1 unit) to get information about reproducibility?
I have problem with my outputs (in the attachments you can see graphs from minitab)
In TunnelDAta.xlsx you could find measurement data in two columns:
First – measurements of 30 units,
Second – 30 measurements of the same unit.
in Gage R&R type 1 I dont see any condition for NDC, can I use data which I used?
Thank you for any help.
Regards