How to define LCL and get process capability for MIN spec requirement

Bev D

Heretical Statistician
Leader
Super Moderator
If I’m interpreting this correctly, I’ve seen this many times. In different guises. It is essentially a guardband especially when the sample size is low and the test is destructive. It’s an attempt to ensure that the entire distribution is above the actual specification lower limit. It isn’t well thought out tho.

And in all honesty I’ve used a version of this for destruct tests on large batches and it is applied for each lot or batch. But you really need more than a single sample - depending on the amount of variation (within lot standard deviation) you need 10-30 samples. This applicable when the within lot variation is stable and it is the average that moves around from lot to lot (in other words a truly non-homogenous process). If the within lot variation isn’t stable you need a slightly different plan. You are essentially estimating the lot average and SD to ensure that the lot is above spec.

Using a single sample that ‘just meets’ the LCL doesn’t guarantee that the lot meets the actual lower spec. And doing it only once per year per tool is silly. But it usually makes those who know very little about statistics and physics feel better.

The OP could take their last pre-production sample (the one that will be implemented in mass production) calculate the mean and SD of the 125 pieces, and set the guardband at the average minus 3SD ( it isn’t a ‘LCL’ OR a spec. It’s a guardband. Words have meanings and we should use them not change them to fit our misinterpretation of the world). If I was forced to stay with an annual sample of 1 I would set the guardband at the spec PLUS 3SD. Which would be ultra conservative for a sample of 1.
 

Jhcho

Registered
Is your customer really looking for a statistical control limit or simply a guard band tolerance?
well the words of the customer(General Motors) was perform a pull test of 30 samples, and establish a control limit.
 

Jhcho

Registered
If I’m interpreting this correctly, I’ve seen this many times. In different guises. It is essentially a guardband especially when the sample size is low and the test is destructive. It’s an attempt to ensure that the entire distribution is above the actual specification lower limit. It isn’t well thought out tho.

And in all honesty I’ve used a version of this for destruct tests on large batches and it is applied for each lot or batch. But you really need more than a single sample - depending on the amount of variation (within lot standard deviation) you need 10-30 samples. This applicable when the within lot variation is stable and it is the average that moves around from lot to lot (in other words a truly non-homogenous process). If the within lot variation isn’t stable you need a slightly different plan. You are essentially estimating the lot average and SD to ensure that the lot is above spec.

Using a single sample that ‘just meets’ the LCL doesn’t guarantee that the lot meets the actual lower spec. And doing it only once per year per tool is silly. But it usually makes those who know very little about statistics and physics feel better.

The OP could take their last pre-production sample (the one that will be implemented in mass production) calculate the mean and SD of the 125 pieces, and set the guardband at the average minus 3SD ( it isn’t a ‘LCL’ OR a spec. It’s a guardband. Words have meanings and we should use them not change them to fit our misinterpretation of the world). If I was forced to stay with an annual sample of 1 I would set the guardband at the spec PLUS 3SD. Which would be ultra conservative for a sample of 1.
For this test, I already did a pull test of aprox 40 samples of the same lot.

this is the data I obtained from this test and if I apply
Mean-3*stddev I get -1074N which is not a realistic number
If I apply +3SD, i get 4894N which doesn't bring any benefit for my company since it is 49 times higher than the customer requirement, and if I get values below that, will be NG unnecessary

Peak (N)
1305
2436
2579
2383
2027
1804
1623
2028
1536
1579
1619
939
1269
1274
1290
2175
1605
1161
1267
944
3006
1804
2014
1893
1778
1504
1745
1516
1617
1666
1755
3823
6903
1650
1985
1629
1533
 

Bev D

Heretical Statistician
Leader
Super Moderator
Mean-3*stddev I get -1074N which is not a realistic number
Why isn’t this realistic? I know the answer but wan to see why you think it’s unrealistic - this will be critical to moving forward…
 

Jhcho

Registered
Mean-3*stddev I get -1074N which is not a realistic number
Why isn’t this realistic? I know the answer but wan to see why you think it’s unrealistic - this will be critical to moving forward…
Because it is a tolerance that is a negative number. Which is a number that doesnt exist in this case.
 

Bev D

Heretical Statistician
Leader
Super Moderator
Yes but why? One of the first rules of data analysis is to graph the data prior to performing any statistical calcualtions. If you use a simple histogram you can see that this distribution highly skewed to the high side. I certainly isn’t symmetrical or Normal. This creates a large SD that when subtracted from the average creates a lower limit that is not representative of the actual distribution. Sooo, the default ‘Normal’ statistics don’t apply. Now we need to know a few other things in order to propose a different control scheme. There are ways to calculate a ‘lower’ variation adn subtract this from the lowest mean of the process (assuming that there is actual set up to setup variation in production.)

Is this skewness common? Do you know why the skewness exists? Have you performed an MSA? In other words is this measurement error or just the normal skewness of the process? Are there multiple ‘tools’ or ‘cavities’ involved? Is the skewness due to differences in the tools or cavities?

At this point you will probably need to use SPC for Production to demonstrate that you are stable and capable…I would probably start with 5 pieces for the subgroup size, but without knowing the process (how many machines, tools, cavities, what volumes and the natural change points, (such as material lot changes) we can’t suggest a frequency.
 

Semoi

Involved In Discussions
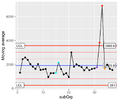
Assuming that the data is a time series of the production process we can use an XmR chart.
Bildschirmfoto 2024-04-27 um 14.00.19.png
The LCL is not negative, but 251. Furthermore, two points are clearly beyond the UCL indicating that (1) your process is not stable, and (2) we should probably use a median range instead of the average range. However, if we simply delete the two extreme outliers we find that they mask other outliers: Only if we eliminate the largest 5 data points, we obtain a SPC chart without a 3 Sigma violation. In this case the LCL is 819.

Here is a second idea: You could evaluate the standard deviation by using only the data points below the median value. This is certainly not a standard method, but with respect to your goal, it certainly outperforms the standard method. E.g. the following code
Bildschirmfoto 2024-04-27 um 14.42.34.png
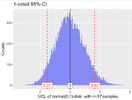
yields LCL = 650. It uses the median as "location parameter". This value should be approx. correct, considering that the uncertainty of this estimate is expected to be rather large -- considering that we have only "few" data points. E.g. if we assume a perfectly normal distribution the control limit posses an uncertainty of approx. 25%. This can be seen in the following image (in the label I wrote UCL, but it is equally applicable to LCL)

Bildschirmfoto 2024-04-27 um 14.52.22.png

The standard deviation of the sample generates an uncertainty. This uncertainty is expressed as "change of the standard multiplication factor" of 3. We see that single-sided 95% confidence interval is either [2.23, 3] or [3, 3.82], which corresponds to an uncertainty of approx. 25%. Hence, the LCL = 650 possess a lower 95% CI of [376, 650] and an upper CI of [650, 906]. The two-sided CI is even larger.
 

Bev D

Heretical Statistician
Leader
Super Moderator
Read The history of the ImR chart by Donald Wheeler.

…the manipulation of mathematical formulas is no substitute for knowing what one is doing…

Agree that a simple ImR chart that excludes the high values will no doubt yield a lower limit that is useable for the customer’s requirement although testing this only nice a year is problematic. We still don’t now anything about the OP’s process and it’s possible different process streams or how these samples were collected. We also don’t know how much of the actual process variation is captured in this sample - are they really sequentially produced in the order listed? Or was this a random sample? Is this only one of several streams?

The Op hasn’t been around for about two weeks and hasn’t responded since the 8th.
 
Top Bottom