M
Matt_B
I am about to submit a short article to a foreign quality magazine and I am skeptical of my experimental conclusions. Can anybody please tell me if I goofed? It is just a small part of the article, but I don?t want to risk making a basic mistake.
I used a homemade catapult to compare a Taguchi L-8 design to a fractional factorial design; both with 8 runs and no replication. The response variable was distance traveled by a projectile and the objective was to find the optimal settings for a greater distance of travel. There is such a large difference between the results that I fear I may be misinterpreting the data.
Settings for factor A should be high according to the fractional factorial. The Taguchi design indicated factor A should be low. Factor A stretches the catapult?s rubber band so it should be high; I did five verification runs with both the fractional factorial settings and the fractional factorial setting threw the projectile just over 50% farther.
I anticipate one of two possible reasons for the discrepancy: the Taguchi design did not account for interactions; or, I made a mistake.
Can somebody clear this up?

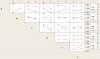
Here is the Minitab output with the results:
[FONT="]Results for: MINITAB FRACTINAL FACTROIAL 2.MTW[/FONT]
[FONT="]Factorial Fit: Response versus A; B; C; D; E; F
[/FONT]
[FONT="]
[/FONT]
[FONT="]Estimated Effects and Coefficients for Response (coded units)[/FONT]
[FONT="]
[/FONT]
[FONT="]Term Effect Coef[/FONT]
[FONT="]Constant 363,13[/FONT]
[FONT="]A 168,25 84,13[/FONT]
[FONT="]B -6,25 -3,13[/FONT]
[FONT="]C -63,25 -31,62[/FONT]
[FONT="]D -177,25 -88,63[/FONT]
[FONT="]E 14,75 7,37[/FONT]
[FONT="]F 17,25 8,62[/FONT]
[FONT="]A*F -9,75 -4,88[/FONT]
[FONT="]S = * PRESS = *[/FONT]
[FONT="]
[/FONT]
[FONT="]Analysis of Variance for Response (coded units)[/FONT]
[FONT="]
[/FONT]
[FONT="]Source DF Seq SS Adj SS Adj MS F P[/FONT]
[FONT="]Main Effects 6 128561 128561 21426,8 * *[/FONT]
[FONT="]A 1 56616 56616 56616,1 * *[/FONT]
[FONT="]B 1 78 78 78,1 * *[/FONT]
[FONT="]C 1 8001 8001 8001,1 * *[/FONT]
[FONT="]D 1 62835 62835 62835,1 * *[/FONT]
[FONT="]E 1 435 435 435,1 * *[/FONT]
[FONT="]F 1 595 595 595,1 * *[/FONT]
[FONT="]2-Way Interactions 1 190 190 190,1 * *[/FONT]
[FONT="]A*F 1 190 190 190,1 * *[/FONT]
[FONT="]Residual Error 0 * * *[/FONT]
[FONT="]Total 7 128751[/FONT]
[FONT="]
[/FONT]
[FONT="]Alias Structure[/FONT]
[FONT="]I + A*B*D + A*C*E + B*C*F + D*E*F + A*B*E*F + A*C*D*F + B*C*D*E[/FONT]
[FONT="]A + B*D + C*E + B*E*F + C*D*F + A*B*C*F + A*D*E*F + A*B*C*D*E[/FONT]
[FONT="]B + A*D + C*F + A*E*F + C*D*E + A*B*C*E + B*D*E*F + A*B*C*D*F[/FONT]
[FONT="]C + A*E + B*F + A*D*F + B*D*E + A*B*C*D + C*D*E*F + A*B*C*E*F[/FONT]
[FONT="]D + A*B + E*F + A*C*F + B*C*E + A*C*D*E + B*C*D*F + A*B*D*E*F[/FONT]
[FONT="]E + A*C + D*F + A*B*F + B*C*D + A*B*D*E + B*C*E*F + A*C*D*E*F[/FONT]
[FONT="]F + B*C + D*E + A*B*E + A*C*D + A*B*D*F + A*C*E*F + B*C*D*E*F[/FONT]
[FONT="]A*F + B*E + C*D + A*B*C + A*D*E + B*D*F + C*E*F + A*B*C*D*E*F[/FONT]
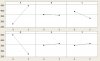
[FONT="]Taguchi Analysis: Response versus A; B; C; D; E; F
[/FONT]
[FONT="]Response Table for Signal to Noise Ratios[/FONT]
[FONT="]
[/FONT]
[FONT="]Larger is better[/FONT]
[FONT="]
[/FONT]
[FONT="]Level A B C D E F[/FONT]
[FONT="]1 52,89 51,33 49,89 51,92 50,93 48,87[/FONT]
[FONT="]2 48,23 49,79 51,22 49,20 50,19 52,25[/FONT]
[FONT="]Delta 4,66 1,54 1,33 2,71 0,75 3,38[/FONT]
[FONT="]Rank 1 4 5 3 6 2[/FONT]
[FONT="]
[/FONT]
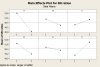
[FONT="]Response Table for Means[/FONT]
[FONT="]
[/FONT]
[FONT="]Level A B C D E F[/FONT]
[FONT="]1 450,8 380,8 345,3 415,8 398,8 308,3[/FONT]
[FONT="]2 275,5 345,5 381,0 310,5 327,5 418,0[/FONT]
[FONT="]Delta 175,3 35,3 35,8 105,3 71,3 109,8[/FONT]
[FONT="]Rank 1 6 5 3 4 2[/FONT]
I used a homemade catapult to compare a Taguchi L-8 design to a fractional factorial design; both with 8 runs and no replication. The response variable was distance traveled by a projectile and the objective was to find the optimal settings for a greater distance of travel. There is such a large difference between the results that I fear I may be misinterpreting the data.
Settings for factor A should be high according to the fractional factorial. The Taguchi design indicated factor A should be low. Factor A stretches the catapult?s rubber band so it should be high; I did five verification runs with both the fractional factorial settings and the fractional factorial setting threw the projectile just over 50% farther.
I anticipate one of two possible reasons for the discrepancy: the Taguchi design did not account for interactions; or, I made a mistake.
Can somebody clear this up?
Here is the Minitab output with the results:
[FONT="]Results for: MINITAB FRACTINAL FACTROIAL 2.MTW[/FONT]
[FONT="]Factorial Fit: Response versus A; B; C; D; E; F
[/FONT]
[FONT="]
[/FONT]
[FONT="]Estimated Effects and Coefficients for Response (coded units)[/FONT]
[FONT="]
[/FONT]
[FONT="]Term Effect Coef[/FONT]
[FONT="]Constant 363,13[/FONT]
[FONT="]A 168,25 84,13[/FONT]
[FONT="]B -6,25 -3,13[/FONT]
[FONT="]C -63,25 -31,62[/FONT]
[FONT="]D -177,25 -88,63[/FONT]
[FONT="]E 14,75 7,37[/FONT]
[FONT="]F 17,25 8,62[/FONT]
[FONT="]A*F -9,75 -4,88[/FONT]
[FONT="]S = * PRESS = *[/FONT]
[FONT="]
[/FONT]
[FONT="]Analysis of Variance for Response (coded units)[/FONT]
[FONT="]
[/FONT]
[FONT="]Source DF Seq SS Adj SS Adj MS F P[/FONT]
[FONT="]Main Effects 6 128561 128561 21426,8 * *[/FONT]
[FONT="]A 1 56616 56616 56616,1 * *[/FONT]
[FONT="]B 1 78 78 78,1 * *[/FONT]
[FONT="]C 1 8001 8001 8001,1 * *[/FONT]
[FONT="]D 1 62835 62835 62835,1 * *[/FONT]
[FONT="]E 1 435 435 435,1 * *[/FONT]
[FONT="]F 1 595 595 595,1 * *[/FONT]
[FONT="]2-Way Interactions 1 190 190 190,1 * *[/FONT]
[FONT="]A*F 1 190 190 190,1 * *[/FONT]
[FONT="]Residual Error 0 * * *[/FONT]
[FONT="]Total 7 128751[/FONT]
[FONT="]
[/FONT]
[FONT="]Alias Structure[/FONT]
[FONT="]I + A*B*D + A*C*E + B*C*F + D*E*F + A*B*E*F + A*C*D*F + B*C*D*E[/FONT]
[FONT="]A + B*D + C*E + B*E*F + C*D*F + A*B*C*F + A*D*E*F + A*B*C*D*E[/FONT]
[FONT="]B + A*D + C*F + A*E*F + C*D*E + A*B*C*E + B*D*E*F + A*B*C*D*F[/FONT]
[FONT="]C + A*E + B*F + A*D*F + B*D*E + A*B*C*D + C*D*E*F + A*B*C*E*F[/FONT]
[FONT="]D + A*B + E*F + A*C*F + B*C*E + A*C*D*E + B*C*D*F + A*B*D*E*F[/FONT]
[FONT="]E + A*C + D*F + A*B*F + B*C*D + A*B*D*E + B*C*E*F + A*C*D*E*F[/FONT]
[FONT="]F + B*C + D*E + A*B*E + A*C*D + A*B*D*F + A*C*E*F + B*C*D*E*F[/FONT]
[FONT="]A*F + B*E + C*D + A*B*C + A*D*E + B*D*F + C*E*F + A*B*C*D*E*F[/FONT]
[FONT="]Taguchi Analysis: Response versus A; B; C; D; E; F
[/FONT]
[FONT="]Response Table for Signal to Noise Ratios[/FONT]
[FONT="]
[/FONT]
[FONT="]Larger is better[/FONT]
[FONT="]
[/FONT]
[FONT="]Level A B C D E F[/FONT]
[FONT="]1 52,89 51,33 49,89 51,92 50,93 48,87[/FONT]
[FONT="]2 48,23 49,79 51,22 49,20 50,19 52,25[/FONT]
[FONT="]Delta 4,66 1,54 1,33 2,71 0,75 3,38[/FONT]
[FONT="]Rank 1 4 5 3 6 2[/FONT]
[FONT="]
[/FONT]
[FONT="]Response Table for Means[/FONT]
[FONT="]
[/FONT]
[FONT="]Level A B C D E F[/FONT]
[FONT="]1 450,8 380,8 345,3 415,8 398,8 308,3[/FONT]
[FONT="]2 275,5 345,5 381,0 310,5 327,5 418,0[/FONT]
[FONT="]Delta 175,3 35,3 35,8 105,3 71,3 109,8[/FONT]
[FONT="]Rank 1 6 5 3 4 2[/FONT]