Cpk Formula seems off, need help!?

A

Aleforge

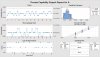
This is driving me nuts. I have not completed many CPKs before and previously I have used a template to calculate each data set. It was setup for only 30pc inspections, but the new customer needs a 35pc. So I attempted to modify my excel sheet to incorporate the extra parts. However I am getting weird CPK results.

For instance I have one sample that only deviates .002 from the nominal (tol is +/- .005). However my CPK number is coming out as .8468. That does not seem right to me? As I mentioned I am fairly new to CPKs in general and relied solely on a template that I did not create.

(ugh site won't allow me to link drop box file)

I was under the impression that "good" CPKs should hover around the 1.5 mark.

Thank you VERY much!

If anyone WILL take a look at the file please let me know and I will PM it.
 

Bev D

Heretical Statistician
Leader
Super Moderator
without seeing the data I would venture a guess that the example you have given is due to chunky data. chunky data is data that has very few possible results compared to the range of the variation. (for example if the range of variation goes from .001 to .005 and the resolution of the gage is in .001 you will have chunky data) Chunky data results in an overstated standard deviation which would then result a smaller Cpk.
 
A

Aleforge

OK, so I just edited the results and spread them around more. And the Cpk dropped down to a .3937.... All of the measurements still are inside the tolerance, but tilting towards both ends. Each time I changed one the Cpk dropped.

On my second set of measurements I have a Stdev of only .0009 , the above mentioned is a .0020 now. The .0009 Stdev one is giving me a Cpk of 1.7363

/sigh

Thank you for helping. I wish I could link the file in here. This is driving me insane, and I have a customer breathing down my back (and starting to look like an idiot). =(
 

howste

Thaumaturge
Trusted Information Resource
Here's the file that Aleforge wanted to post:
 

Attachments

  • CAPA WTH.xlsx
    21 KB · Views: 669

howste

Thaumaturge
Trusted Information Resource
Your data in the first column are all on the low side of the tolerance. The Cp value looks good, but the process average needs to be shifted to get a good Cpk.

If the process is centered on the nominal, the Cpk would equal the Cp.
 
Last edited:

Miner

Forum Moderator
Leader
Admin
While you definitely have chunky data due to measurement resolution, the bigger issue is that the process for feature A is not centered on the nominal, but is shifted to the lower spec limit.
 

Attachments

  • Process Capability Sixpack Report for A.jpg
    Process Capability Sixpack Report for A.jpg
    109.9 KB · Views: 513
A

Aleforge

OK, so I shifted all of them between .279 to .281 and now my CPK is 2.429 and CP 2.608 as you said it would.

I suppose I am confused on how this works and had some misconceptions. For instance I assumed as long as your in tolerance you would have a higher CPK.

Which leads me to guess in order to get a good Cpk you need to have the part dimensions balanced out (like a see-saw)? Although the farther they are spread, the lower Cpk you end up with correct?

SO... was the first number I came up right, considering they were tilted all one way?


One thing I noticed is I have one Cpk coming in around 5.578. I suppose it's right but that leads me to wonder how high a Cpk can go up? (too lazy to change all my numbers dead on to see).

I really appreciate the help, it makes a lot of sense now. I finally feel I can move forward with some confidence.
 

howste

Thaumaturge
Trusted Information Resource
If you look at the bell-shaped normal curve on Miner's post, you can see that part of the distribution is under the lower specification limit. The calculations you made are based on a sample from the total population of parts, which are estimates of the population. If you measured and plotted, for example, 1000 part readings from the same process without adjustment (assuming that it's normal) it should look like the normal curve and you would actually find that some parts are below the lower specification limit.

Statistically speaking, a Cpk of 1.0 would show up if your process center is 3 standard deviations from the closest of an upper or lower spec limit. A Cpk of 1.33 would be 4 standard deviations away, and a Cpk of 1.67 would be 5 standard deviations away. The farther you are from the spec limits, the higher the probability is that you will have no bad parts.
 
A

Aleforge

Thank you Howste, I finally have a grip on how it works. I appreciate your help as well as everyone else's. =)
 
Top Bottom