N
ncwalker
Here is the question: If I have "n" cavities in a mold (or "n" fixtures in a machining process, or "n" processes in parallel for that matter....), if a random sampling across n cavities yields a capable process (the collective output) does that mean that each of the individual outputs is capable?
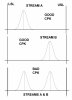
The reverse is obviously not true. Individually capable parallel paths do NOT mean the collective is capable. You just have to think about it: say the output of two cavities has a high Cp, like Cp=8 on an inside diameter. This means I have very little variation with respect to the tolerance. But now assume the Cpks are JUST acceptable. Say 1.4 for each one. Further, with these metrics, it is possible that the output of Cav 1 is bumping the lower spec, but with a nice, tight group. And the output of Cav 2 is bumping the upper spec also with a nice tight group.
Now if I take random samples from both of these distributions, well, my sigma is gonna be pretty high. It will show I am eating all my tolerance up (unless my subgroups are restricted to all being from the same cavity, and even then). So the collective capability will be pretty bad.
This does NOT mean my individual cavities are out of control. They are in control, albeit they could use some centering. But if I am putting this in control output in boxes that are mixed and sent to my customer (face it, they don't want to be able to tell the difference between cavities) and THEY do a study on my collective output in their receiving department... They're not gonna be happy.
But what about the CONVERSE?
24 cav mold? That's expensive and time consuming to do a study on that..... Can I say with certainty that if I grab 36 samples from a box of mixed parts and this population IS capable, then each individual cavities are capable?
Note that if I pull 36 samples, that doesn't leave much room for duplicates.... do I want that truly random? Or do I pull 24, one from each cavity, then another 12 at random? Or maybe one from each cavity so that second draw contains no repeats.....
Or am I better off with a more controlled experiment? Like doing a furnace map? Do I take n from a couple corner cavities, n from a couple center cavities? Or maybe my selection is based on watching the process, maybe with a pyrometer for a molding process taking some from the cooler, hotter, and middle cavities temperature wise?
OK to say do what the customer wants, and I understand this. But they are paying ME for my expertise in the fabrication of the part. So I should get a say in what makes sense ..... (provided it does).
")