MSA (Measurement System Analysis) on a Bore Measurement - Good or bad result?

D

daveatwork

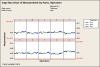
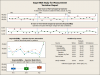
I have just completed a crossed MSA on a bore measurement.
Tolerance 0.10mm 3 ops, 10 parts, 3 replicates.

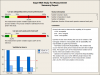
The results show 34% contribution (=NOK as this is > 9%) and 17% against tolerance (=acceptable as this is between 11 - 30%).

Does this mean that the result is acceptable? On the face of it I would think NO as the gauge is thrown out on the % contribution but the relativley high tolerance of 0.1mm suggests that the result is potentially OK.

Any guidance would be gratefully appreciated.
 

Miner

Forum Moderator
Leader
Admin
Re: MSA - Good or bad result?

It depends on the intended use for the gauge. If you intend to use the gauge for inspection, it is acceptable. If you intend to use it for SPC, or as part of a Six Sigma study, it is not acceptable.
 

Bev D

Heretical Statistician
Leader
Super Moderator
Re: MSA - Good or bad result?

it really depends on the variation of the parts in your study.


can you post your data along with the spec limits?
 
D

daveatwork

Re: MSA - Good or bad result?

It depends on the intended use for the gauge. If you intend to use the gauge for inspection, it is acceptable. If you intend to use it for SPC, or as part of a Six Sigma study, it is not acceptable.

Thanks for the quick respons to my first post. The gauge will initially be used for periodic inspection, but I cannot rule out that one day it may be used for some six sigma study activity. From the results, what factor differentiates what the gauge can / cannot be used for.

My understanding is that the OK to tolerance means that the gauge is adequate within the 0.1mm tolerance range (quite a generous tolerance) but has inherent varaibility (across parts / operators) which limits it's overall reliability. Is this correct?
 
D

daveatwork

Re: MSA - Good or bad result?

Thanks Bev - I will send the data tomorrow when I am back at my desk.
 
D

daveatwork

Re: MSA - Good or bad result?

Thanks Bev - I will send the data tomorrow when I am back at my desk.


Bev - data attached as promised. I also noticed only 1 distinct category in the minitab report which could possibly (?) be due to the lack of range in the parts selected maybe (the parts do not cover the whole tolerance range - only ~15% of the range with no "outsiders").

Again - any help is appreciated.
 

Attachments

  • MSA TB1.xls
    29 KB · Views: 192

Miner

Forum Moderator
Leader
Admin
Re: MSA - Good or bad result?

Thanks for the quick respons to my first post. The gauge will initially be used for periodic inspection, but I cannot rule out that one day it may be used for some six sigma study activity. From the results, what factor differentiates what the gauge can / cannot be used for.

My understanding is that the OK to tolerance means that the gauge is adequate within the 0.1mm tolerance range (quite a generous tolerance) but has inherent varaibility (across parts / operators) which limits it's overall reliability. Is this correct?
In essence, you are correct. I recommend that you read my blog on MSA, particularly Part 5, which focuses on the R&R study.
 
B

Barbara B

Re: MSA - Good or bad result?

The parts are very similar (see attached Gage Run Chart with spec limits). Maybe they reflect the process range, but to avoid wrong conclusions for the GRR%(process) it would be more precise to use the historical standard deviation instead of the part variation based on the selected parts (see Minitab Assistent Whitepaper for Gage R&R (crossed), p.4f. for details).

You can get the GRR%(process) with the historical standard deviation in Minitab either out of the Gage R&R-menu:
Stat > Quality Tools > Gage Study > Gage R&R (Crossed)
> Options: historical standard deviation
or out of the Assistant (only available in Minitab R16):
Assistant > Measuremen System Analysis (MSA) > Gage R&R (Crossed)
Use historical standard deviation: ... (strongly recommended)
 

Attachments

  • Gage Run Chart of Measurement.png
    Gage Run Chart of Measurement.png
    6.3 KB · Views: 247
  • Gage R&R Study for Measurement - 1 Report Card.png
    Gage R&R Study for Measurement - 1 Report Card.png
    21.2 KB · Views: 272
  • Gage R&R Study for Measurement - 2 Variation Report.png
    Gage R&R Study for Measurement - 2 Variation Report.png
    21.3 KB · Views: 230
  • Gage R&R Study for Measurement - 3 Summary Report.png
    Gage R&R Study for Measurement - 3 Summary Report.png
    22.8 KB · Views: 289

bobdoering

Stop X-bar/R Madness!!
Trusted Information Resource
Did you make sure you measured the same location on the part? Within-part variation of the part is not the gage's fault, and should not be included.
 
D

daveatwork

Did you make sure you measured the same location on the part? Within-part variation of the part is not the gage's fault, and should not be included.

Hi. Parts were measured in the same location. Fortunatley there are some features on the part that help line up the gauge with the part.

Having delved a little deeper, I have found that the parts are manufactured using "form tooling" (hence the small range) and are therefore not likely to change dimension a great deal (apart from long term tool wear). I have requested some special parts be made with a greater range inc parts out of tolerance so I can repeat the study and see what this does to the result.
 
Top Bottom