G
G.Pito
Dear all,
I have copied values for GR&R from AIAG MSA 4th edition into an excel spreadsheet and then entered them in Minitab 18 in order to compare results with those written in the manual. It is the typical configuration with:
N.3 Appraisers
N.3 Trials
N.10 Operators
I don't understand why AIAG and Minitab results are slightly different, especially for the way they consider Interaction and Degrees of Freedom.
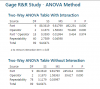
In the first image, you can see the results as they come from AIAG Manual. In the manual, the F ratio is calculated using Operator*Part interaction at the denominator, and then evaluated: since its value is lee the F critical one, the interaction is calculated pooling with equipment (error) value, maintaining the same degrees of freedom (and thus the MS Mean Squares):
(please find the attached image ANOVA MSA AIAG.png)
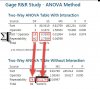
while Minitab calculates the same way the 1st part but then (considered that P > 0.25) another table is displayed where F is calculated versus Equipment (Error) and using different degrees of freedom. Here the Minitab results:
(please find the attached image ANOVA MINITAB.png)
1) Does anybody could explain why AIAG MSA and Minitab use different degrees of freedom when they calculate F ratio versus the Equipment?
2) Where does the P value 0.25 comes from? (it is the value Minitab use for choosing if to display the "Without interaction" panel if Alpha 0.05 is chosen)
Thank you very much!
I have copied values for GR&R from AIAG MSA 4th edition into an excel spreadsheet and then entered them in Minitab 18 in order to compare results with those written in the manual. It is the typical configuration with:
N.3 Appraisers
N.3 Trials
N.10 Operators
I don't understand why AIAG and Minitab results are slightly different, especially for the way they consider Interaction and Degrees of Freedom.
In the first image, you can see the results as they come from AIAG Manual. In the manual, the F ratio is calculated using Operator*Part interaction at the denominator, and then evaluated: since its value is lee the F critical one, the interaction is calculated pooling with equipment (error) value, maintaining the same degrees of freedom (and thus the MS Mean Squares):
(please find the attached image ANOVA MSA AIAG.png)
while Minitab calculates the same way the 1st part but then (considered that P > 0.25) another table is displayed where F is calculated versus Equipment (Error) and using different degrees of freedom. Here the Minitab results:
(please find the attached image ANOVA MINITAB.png)
1) Does anybody could explain why AIAG MSA and Minitab use different degrees of freedom when they calculate F ratio versus the Equipment?
2) Where does the P value 0.25 comes from? (it is the value Minitab use for choosing if to display the "Without interaction" panel if Alpha 0.05 is chosen)
Thank you very much!