Count NDC from Graphik Sample Range vs R chart

R

Rio BP Simbolon

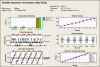
I already executed MSA Outside for Collar body with spec 8,3 -8,5 mm, used caliper.
NDC = 11
my question, Can NDC be counted from graph? how can it be?

please your comment about our MSA graph (attached)


Question for Moderator
Why file mini-tab can't be uploaded?

best regards

Rio BPS
 

Attachments

  • COllar Body.jpg
    COllar Body.jpg
    47.4 KB · Views: 183

Bev D

Heretical Statistician
Leader
Super Moderator
Re: Count NDC from Graphik Sampel Range vs R chart

NDC can be calculated from a graph but not the standard Minitab / gage R&R graphs.

you need a youden plot. this is a square plot with a 45 degree line eminating from 0:0.

plot the points as a scatter diagram with the first reading on the X axis and the second reading on the Y axis

you draw a rectangle parrallel to the 45 degree line that just fits around all of the points. using your ruler, you measure the width of the short end of the rectangle (that is perpindicular to the 45 degree line). this is the measurement error range.

you then count how many of these widths can fit in the long portion of the rectangle (parallel to the 45 degree line)
 
R

Rio BP Simbolon

Re: Count NDC from Graphik Sampel Range vs R chart

Thanks Bev D
"on the X axis and the second reading on the Y axis", what point are X and Y?
 
R

Rio BP Simbolon

Re: Count NDC from Graphik Sampel Range vs R chart

Bev D
Thanks for your explanation..
my next question: "on the X axis and the second reading on the Y axis", what point are X and Y?
 

Bev D

Heretical Statistician
Leader
Super Moderator
Re: Count NDC from Graphik Sampel Range vs R chart

a scatter diagram plots two values as a single data point. for MSA we take two readings of the same part. the first reading is the x value and the second reading is the y value
 

Miner

Forum Moderator
Leader
Admin
Minitab files

.mtw files only contain the raw data. Minitab also uses .mpj files that contain .mtw files, analyses and graphics.
 
Top Bottom