Understanding why my CpK and PpK are low, and LCL

B

blackanddom

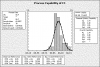
I am having difficulty understanding why my CpK and PpK are under the acceptable value. Our process is very stable, and SPecs are 65.8+-0.4 for the results below. Does my process need to be more out of control in order to properly calculate or identify CpK? I had the same issue last week determine gauge R&R because our process was so stable.

Thanks!

View attachment ID SPC WM 17.xlsx
 

mdurivage

Quite Involved in Discussions
Re: CpK, PpK, and LCL

Even if a process is stable, it may not be capable (ie Swiss watch parts made with blacksmith tools). The process is not centered and is running high from nominal (did not verify normality). By looking at the numbers, if you centered the process, you would probably be ok.
 
B

blackanddom

Re: CpK, PpK, and LCL

by "centering the process" does this mean instead of plotting my points from target (65.8), plot them from the mean of the results (65.9)?

Secondly, this would be centering my calculations, not altering data correct? I will still be able to justify that all results were within spec even if my capability results were based of the mean, not the target?

Thanks again.
 
B

blackanddom

Re: CpK, PpK, and LCL

I changed my UCL and LCL to meet the spec, not to be calculated based off of the results, and the CpK went up some. Is this the wrong way to approach this problem?
 

mdurivage

Quite Involved in Discussions
Re: CpK, PpK, and LCL

by "centering the process" does this mean instead of plotting my points from target (65.8), plot them from the mean of the results (65.9)?

Secondly, this would be centering my calculations, not altering data correct? I will still be able to justify that all results were within spec even if my capability results were based of the mean, not the target?

Thanks again.

I meant adjusting the process to the target dimension.
 
B

blackanddom

Re: CpK, PpK, and LCL

I think what im failing to realize is even though the results are slightly high, they are very close to target. Also, no results are even NEAR out of spec.
How is it that a process can run so close to perfect, but because its running one side of center (by so little), that the process capability is so low?
Our process is CLEARLY capable of making a product meeting specifications, with little to no variation, over MANY samples.
These are the samples used for PPAP. What suggestions might you have to show they pass? even though the calculations show they don't?
 

Bev D

Heretical Statistician
Leader
Super Moderator
Sorry for some reason I can't see the content (image?) of the EXCEL file you attached.

can you post your actual data?
 
B

blackanddom

Subgroup: Date/Time: Observation:
1 9/20/2013 12:50:39 PM 65.8
2 9/20/2013 1:04:26 PM 66.1
3 9/20/2013 1:10:14 PM 65.8
4 9/20/2013 1:15:14 PM 65.9
5 9/20/2013 1:19:23 PM 66.0
6 9/20/2013 1:23:24 PM 66.0
7 9/20/2013 1:42:14 PM 65.9
8 9/20/2013 1:48:30 PM 65.9
9 9/20/2013 1:52:08 PM 65.9
10 9/20/2013 1:58:08 PM 66.0
11 9/20/2013 2:01:48 PM 65.9
12 9/20/2013 2:03:24 PM 65.9
13 9/20/2013 3:20:30 PM 65.9
14 9/20/2013 3:20:36 PM 65.9
15 9/20/2013 3:20:42 PM 65.9
16 9/20/2013 3:20:48 PM 65.9
17 9/20/2013 3:20:53 PM 66.0
18 9/20/2013 3:20:59 PM 66.0
19 9/20/2013 3:21:04 PM 65.9
20 9/20/2013 3:21:10 PM 65.9
21 9/20/2013 3:25:59 PM 66.0
22 9/20/2013 3:26:05 PM 66.0
23 9/20/2013 3:26:08 PM 66.0
24 9/20/2013 3:26:14 PM 65.9
25 9/20/2013 3:26:19 PM 65.9
26 9/20/2013 3:26:23 PM 66.0
27 9/20/2013 3:26:28 PM 66.1
28 9/20/2013 3:26:32 PM 65.9
29 9/20/2013 3:26:37 PM 66.0
30 9/20/2013 3:26:43 PM 65.9

Group Range: All
Auto Drop: Off

Individuals: Range:
UCL: 66.3 0.2
LCL: 65.8 0.0
PCL 65.9 0.1
Sigma 0.1
Average 65.9

CpK= 0.87

USL= 66.2
LSL = 65.4
Target = 65.8

my avg is 0.1mm above target, no values even near OOS. Im confused why this is not a capable process.

Does this help?
 

Statistical Steven

Statistician
Leader
Super Moderator
I tried to attach it again it wouldn't work

I attached the output from Minitab. You can see your process is running close to the upper specification, we an expected 757.80 PPM out of specification. I am not sure what your requriements are, but this process looks good, though needs to be centered.
 

Attachments

  • Process Capability of C1.png
    Process Capability of C1.png
    10.1 KB · Views: 273
Top Bottom