Update Plots from the Stat Menu

Oszi Batyam

Registered
I have a data-set I keep updating and want to use some plot of the Stat menu (Pareto, Main Effects, Interaction). Unfortunately it seems not to be possible, only graph from the graph menu seem to be updatable. Does anyone know about Tricks/Macros to update these Plots?
 

Miner

Forum Moderator
Leader
Admin
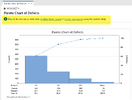
If you have Minitab 20 or newer, use the highlighted options below for the Pareto. The Update option changes the existing chart, while the Create option creates a new chart in addition to the old.

The reason this does not appear for Main Effects or Interaction plots is because you have to rerun the analysis (e.g., ANOVA) in order to create the graphs.


1707843510546.png

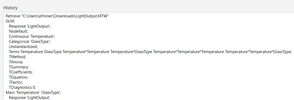
The easiest way to create a macro is to run your analysis then go to View > Command Line/History, look at the History box in the lower right.

1707844204065.png

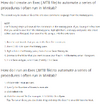
You can create an EXEC file that runs like a macro.
1707844507685.png
 
Top Bottom