Calculating UCL (Upper Control Limit) and LCL (Lower Control Limit)

K

Kenwatch

I would like to know the opinion of the forum in the following case.
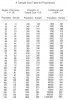
I am trying to calculate the UCL and LCL for a set of measurements.
I took one measurement per day, three months in a row.
For calculating the limits, I used the following procedure:

1. Calculate the Average
2. Calculate the Median Range
3. Calculate control limits using following formula:

UCL= Average + 3.14*Median Range
LCL= Average - 3.14*Median Range

I was told that this is the correct way to calculate the UCL and LCL. For your convenience, I attached the excel file with my calculation.
Please, let me know what is your opinion in this case. Is this the correct way or should I do it differently?
Thank you,
 

Attachments

  • UCL-LCL calculation.xls
    217.5 KB · Views: 1,080

Steve Prevette

Deming Disciple
Leader
Super Moderator
It is one correct way to do it. Though I will say that normally I see if people use the median moving range, they also use the median for the centerline. Davis Ballestracci is a proponent of medians, and if you google him you will find materials on use of medians.

Here is a web site that uses the method you list - http ://www .wayworld .com/spc/spc_08.cfm - DEAD 404 LINK UNLINKED

The other two options are using the average moving range, and the statistical standard deviation.

All three methods - IN THE LONG RUN - should give the same answer IF the data are stable, independent from one point to the next, and normally distributed. The 3.14 factor for medians and 2.66 for moving range are based upon the normal distribution. I personally prefer the use of the statisticaly standard deviation in order to go back to Shewhart's original invocation of the Tchebychev Inequality, but that is not a popular point of view.

I have found (and so has Wheeler) that the 2.66 factor doesn't make a practical difference when the data are nonnormal.

The short answer - yes, the combination you quoted will work.
 
Last edited by a moderator:
K

Kenwatch

Thank you very much for your opinion.
I saw a lot of discussion regarding the calculation of UCL and LCL. It seems that people do not like to agree to a common, general accepted way of determining these limits.
I agree that in real life we have a multitude of cases where one single approach is not good enough. Still, in my opinion, we should be able to approach the data study in the same way. Would not that be a correct assumption?
On the other hand, I have a question regarding the size of the data population taken in consideration. Theoretically, the more data I have available, the more accurate should be my result. In reality, the more data I have, the more variation is included in it, therefore, my UCL and LCL will stretch more. How do you determine the optimum size of data population to be used in such case? My assumption is that it must be a correlation between time and frequency of the process (how many parts in a certain period of time). Any thoughts on this?
 
K

Kenwatch

Regarding the data population size, I have found a table that estimates the sample size based on the population size. Is this a good guide on establishing the sample size of the data I need to use?
Any opinion would be highly appreciated.
Thank you,
 

Attachments

  • Sample size.jpg
    Sample size.jpg
    59.5 KB · Views: 432

Bev D

Heretical Statistician
Leader
Super Moderator
Still, in my opinion, we should be able to approach the data study in the same way. Would not that be a correct assumption?
well, the common approach is not which mathematical formula to apply, but to have an understanding of how the process will vary so that we can create rational subgroups and then to plot our data in time series. THEN the approprite mathematical formulas and any necessarry adjustments to our subgrouping scheme can be made. Physics and rational thought preceed mathematics.

On the other hand, I have a question regarding the size of the data population taken in consideration.
Again in the case of SPC there is no mathematical formula for determining the SPC baseline size. There is a general rule of thumb that 20-25 subgroups that are generally stable are required to create the baseline. No process is ever exactly stable and it sure doesn't stay that way for long. the more data you collect the more opportunities for capturing assignable causes. If the source of these assignable causes can be determined and they are 'removable' in practice, then the data points may be excluded form teh calculations of the control limits. Remember the point is to come up with a subgrouping and sampling scheme that makes sense and limits that will balance the number of false alarms (no assignable cause exists) or the number of missed alarms (assignable cause occured and we missed it). We want to minimize tampering but detect and remove real sources of practically important changes to the process
 

Steve Prevette

Deming Disciple
Leader
Super Moderator
Could you give a reference for where the table came from? I suspect it has to do with go-no go random sampling which may not be applicable to what you are asking. If I am doing go-no go sampling, I shift my standard deviationto the binomial distribution = average +/- sqrt ( average * (1 - average) / n)
 

Bev D

Heretical Statistician
Leader
Super Moderator
nice catch Steve.

In addition to your comments about which chart type is appropriate and my comments regarding the minimal value any sampel size calculation has for SPC purposes, the table is also 'outdated' as it uses population sizes and has no reference to the failure rate which directly relates to the standard deviation which is the top driver of sampel size when trying to estimate a process that provides categorical data...

Kenwatch - it might be helpful if we could understand your sources of information - they appear to be somewhat outside the norm for SPC guidance...
 
K

Kenwatch

Yes, you are right. I found the table on internet. Honestly, I cannot remember which site. I have it for quite some time.
 
K

Kenwatch

It is very difficult in some cases to determine the root cause of assignable causes. This is actually the reason I collect the data and try to make sense out of it: to find out what, where, when, who and how.
I would be more than happy if I could find a procedure which leads me to the root cause of an issue, in my case the variation of the data.
I have to check welded nuts with a torque wrench (not by myself, this the biggest problem). It is the classical scenario. Still, when is coming to interpreting the results and identifying the causes of data variation, situation becomes blurry. The more I try to clarify the situation, the more questions are coming.
I decided that I will consider one of the most accepted ways to calculate the control limits and I will go from there. After that, I will consider variations due to:
- process
- tools
- operators
- measurement tool
- method(technique) of taking the measurements
If I can address all these and improve them a little bit, I am convinced that I will end up with a better, more stable process.
 

Hami812

Engineering Program Mg
Steve,

I have seen some writing that suggests that using 3 Std Dev (+ UCL and - LCL) will work no matter what the distribution is. I even posted some questions on this issue and answers suggested the Normal Dist when using control charts with UCL and LCL using 3 Std Dev. I am a newbie at trying to avoid pitfalls, but I am struggling with the myth of Normal distribution versus any kind of distribution and what approach I should take for Control charting non-normal data.
Can you help me understand the myth, or point me in direction of how to understand the non normal data when considering UCL and LCL?
 
Top Bottom