Using Minitab to Compute & Compare the Mean and Standard Deviation Amount

M

markwf

I am so lost in this question. I'm not sure what steps to take nor can I find it in my text book.

The questions asks:

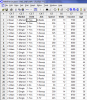
Use Minitab to compute the mean and standard deviation amount spent for each of the Child subsets. In other words, compare the mean and standard deviation amount spent per visit between those who bring children and those who do not. Save these results in the Project file: TME_Unit1.


Here is the data for the question.

Can anyone help?
 

Attachments

  • Using Minitab to Compute & Compare the Mean and Standard Deviation Amount
    DataSet.png
    19 KB · Views: 232

Jen Kirley

Quality and Auditing Expert
Leader
Admin
Welcome to the Cove!

It appears your lesson is regarding normal distribution. N.I.S.T. has a page titled Measures of Scale that explains mean and standard deviation.

I don't use minitab so I did what I so often did when going through my algebra and statistics classes: I looked up tutorials on Google. I did tons of research then! For this subject I found Introduction to Minitab and I also wonder if this How to Use Minitab Wikihow page will help.

Note: to find the mean and standard deviation of each data subset according to child/no child, first that data set will need to be sorted.

The Cove is slow for this holiday weekend, but I hope to have given you enough to proceed with.
 
M

markwf

Thanks for the reply =)

However, I know what mean and standard deviation and how to calculate them by hand.
I just don't know how to sort my data and the commands in Minitab to figure it out; since one column is a text variable and the other one is a numeric variable. Most of the functions in the program will only calculate data that is a numeric variable.
I hope that made sense.

Thanks for the links though, I'll be sure to read through them.
 
A

Avtaar

Thanks for the reply =)

However, I know what mean and standard deviation and how to calculate them by hand.
I just don't know how to sort my data and the commands in Minitab to figure it out; since one column is a text variable and the other one is a numeric variable. Most of the functions in the program will only calculate data that is a numeric variable.
I hope that made sense.

Thanks for the links though, I'll be sure to read through them.
Are you asking about the sequence of commands to calculate mean and std dev in Minitab? Not sure which version you are using, for MINITAB 14 this is described below.

Let's say you have a column of data, (let's say it's under C1), and you want to find the mean and standard deviation of the data under C1.
1. Click on "Calc"
2. Click on "Column Statistics"
3. Under column statistics select "Mean" or "Standard Deviation"
4. For "Input Variable" enter: C1 (or select it from the list on the left)
5. Click "OK"

The mean or std dev of data under C1 should be displayed in your Session Window.

Let me know if you have any further problem.

Just to add to this : you have rightly mentioned that you need numeric values for calc of mean and std dev, so you will have to edit and sort the data in the worksheet (See the Edit & Data function in the Minitab) to achieve this.
 
Last edited by a moderator:
A

Allattar

Use Stat>Basic Stats>Display descriptive statistics.

Put spend as the variable and the factor as the by variable.

Thats if I have understood the problem correctly.
 
S

Sundaresan

I am using Minitab 17 for ANOVA. I use 15 vaules for one series. I calculated the mean and standard deviation for this 15 values. But the standard deviation is very high. If I delete some values, I can reduce the standard deviation.
Is there an option in Minitab17 that automatically delete and indicate some values which are out of range so that the standard deviation is low.
Thanks in advance for the help.
 

AlanC

Involved In Discussions
Hi,
have you checked if the data is normal. Just because they are extreme points the data may still be valid
 
S

Sundaresan

Thank you for your reply. But my problem is, I have 15 different values. The standard deviation is around 150. I want to reduce the standard deviation to below 50 by deleting some values which are out of range. I can delete those values by myself. But is there an option in Minitab17 to do this. If there is an option can you please explain how to do?
 
Top Bottom