G
gaspiston
I have a question about bias and linearity studies which I hope you guys can help me with.
I recently performed a Bias and Linearity studies on a tool. We are measuring a film thickness on a substrate. The NIST traceable standard used for the Bias study is 45A +/- 4A (A=Angstroms).
When I performed the study the tool is measuring on average 42.2A. Which gives me a bias of -2.8A. According to the statistics (t-test) -2.8A is significantly different than zero at 95% confidence level. My question is as follows:
1) If the NIST traceble substrate that I am measuring to perform the Bias study is 45A +/- 4A (41A to 49A). Is it fair to say that I do not have a bias problem? Because bias is much small than the uncertainty of the traceable standard.
2) There a way to mathematically insert the uncertainty of the standard into the calculations?
One of the methods that we use to see if there is a significant difference between the measured values and the known value is to compare the zero to the upper and lower confidence interval of the bias. If zero is between the two values and you can conclude that the bias is not significant.
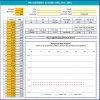
Results:
refer value = 45A +/-4
measurments") =30
=30
df=29
tcrit=2.04523
average=42.20
stdev=.23
sterr=.04
Avg Bias=-2.79633
t=66.62243
lower 95% Conf Int of Bias = -2.88
upper 95% Conf Int of Bias = -2.71
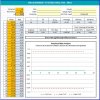
Would it be statistical valid to add the uncertainty of the standard to upper and lower conf intervals?
lower 95% Conf Int of Bias = -2.88+4=1.12
upper 95% Conf Int of Bias = -2.71-4=-6.71
Your Expert Advice is greatly appriciated.
Thanks,
GP
I recently performed a Bias and Linearity studies on a tool. We are measuring a film thickness on a substrate. The NIST traceable standard used for the Bias study is 45A +/- 4A (A=Angstroms).
When I performed the study the tool is measuring on average 42.2A. Which gives me a bias of -2.8A. According to the statistics (t-test) -2.8A is significantly different than zero at 95% confidence level. My question is as follows:
1) If the NIST traceble substrate that I am measuring to perform the Bias study is 45A +/- 4A (41A to 49A). Is it fair to say that I do not have a bias problem? Because bias is much small than the uncertainty of the traceable standard.
2) There a way to mathematically insert the uncertainty of the standard into the calculations?
One of the methods that we use to see if there is a significant difference between the measured values and the known value is to compare the zero to the upper and lower confidence interval of the bias. If zero is between the two values and you can conclude that the bias is not significant.
Results:
refer value = 45A +/-4
measurments
=30df=29
tcrit=2.04523
average=42.20
stdev=.23
sterr=.04
Avg Bias=-2.79633
t=66.62243
lower 95% Conf Int of Bias = -2.88
upper 95% Conf Int of Bias = -2.71
Would it be statistical valid to add the uncertainty of the standard to upper and lower conf intervals?
lower 95% Conf Int of Bias = -2.88+4=1.12
upper 95% Conf Int of Bias = -2.71-4=-6.71
Your Expert Advice is greatly appriciated.
Thanks,
GP
Last edited by a moderator: