Binary logistic regression for attribute/discrete data

J

jayjo

Hello, I am trying to do a statistical analysis of a fraud prevention process. The only two possible outcomes are confirmed fraud or no fraud found. The factors being examined are all yes or no. I believe the appropriate analysis is a binary logistic regression however I have been unable to format the data correctly in minitab and am unclear how to set up the analysis. The examples in minitab's help function all seem to involve variable data. Any input is greatly appreciated.
 
A

Allattar

How does the data appear in Minitab. The dialogue choices depend on how you have set the data up, whether listing event by frequency or a row and a result.

The other to be aware of, any categorical factor you are using must be entered into the model, AND declared as a factor.
If you can give an example of the data structure we can maybe see whats happening. Also if it gives any error messages let us know what it tells you.
 

Statistical Steven

Statistician
Leader
Super Moderator
How does the data appear in Minitab. The dialogue choices depend on how you have set the data up, whether listing event by frequency or a row and a result.

The other to be aware of, any categorical factor you are using must be entered into the model, AND declared as a factor.
If you can give an example of the data structure we can maybe see whats happening. Also if it gives any error messages let us know what it tells you.

Use 0 and 1 for your response. Use Binary Logistic regression and under model put your independent factors.
 
A

Allattar

0 and 1 works quite well, but you can use anything.
As long as you use only two values Minitab will work correctly, you could use YES and NO, or Pass Fail.
Only issue is the worksheet is case senstive, say 0 and 1 are quite desirable in that they are easily identified numerically as only two values. In terms of data entry they are less at risk of typo's.

Where if you use YES and NO. YES, Yes and yes will be seen as different values categorically.

Of course two easy methods to correct a column like this is to use either find and replace, or to use the Proper command in the calculator.
Proper is fantastic, it returns the proper case for all text in the column.
 
Z

zellle

I am trying to find out if there is any correlation between shifts 1 and 2 workers for the number of errors made by them in the 2 shifts.

how do i set the data in minitab and where can i find binary log reg in minitab ?

thanks !
 

Bev D

Heretical Statistician
Leader
Super Moderator
I am trying to find out if there is any correlation between shifts 1 and 2 workers for the number of errors made by them in the 2 shifts.

how do i set the data in minitab and where can i find binary log reg in minitab ?

thanks !

welcome to thte cove zellle :bigwave:

for the analysis you want to do binary logistic regression is probably 'overkill'
a simpler approach will probably work just as well. you can plot the count of errors for both shifts over the same time period along with their confidence intervals (Exact Poisson - I think Minitab does this but I can send the excel formulas if not) the other slightly different approach is to plot the number of errors in each shift divided by the manhours worked and again plot the confidence intervals for the rate. if the intervals overlap there is no statistically significant difference

an even better approach is to plot the number of errors per product volume per week in time sequence for each shift and compare the results - if you have that much data. Use a control chart (c chart for simple error counts or u chart for rate). this approach will detect smaller differences, if they exist.
 

Steve Prevette

Deming Disciple
Leader
Super Moderator
A binomial analysis or even a p-chart control chart would be sufficient. Logistic regression really for if you have 1's and 0's versus some continuous variable.
 
B

Barbara B

If you're only interested in the comparison of the error rates / amount of two workers, binary logistic regression could be used, but this is a little bit like cracking a nut with a sledgehammer. Other (simpler) methods as mentioned before can be helpful without the whole modelling details of BLR (binary logistic regression).

But if you have other variables with a possible impact on the number of errors BLR is a powerful method to select the vital variables and/or estimate odds ratios and so on.

Even if binary logistic regression has "regression" as a part of the name, this model is able to evaluate effects of
  • numeric variables (e.g. time, temperature) and
  • categorical variables / factors (e.g. shift early/late/night, material A/B) and
  • interactions between the variables (e.g. time*shift) and
  • quadratic effects of (e.g. time*time)
in general (and in Minitab ;)).

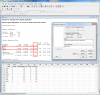
Attached you'll find a screenshot how data could be used for a BLR with categorical and numerical variables and the interaction between a categorical and numerical variable:
Probability(error in test) = effect(shift) + effect(worker) + effect(temperature) + effect(worker*temperature)

The Minitab project file is attached within a zip archive.

A comparison of 2 poisson rates can be done in Minitab using:
Stat > Basic Statistics > 2-Sample Poisson Rate
 

Attachments

  • Example binary logistic regression 2012 08 22.png
    Example binary logistic regression 2012 08 22.png
    49.2 KB · Views: 239
  • Example binary logistic regression 2012 08 22.zip
    50.1 KB · Views: 109
Top Bottom