DOE Analysis - Experiments with 5 Factors

S

seasonal

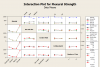
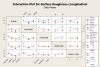
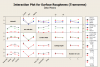
I did experiments with 5 factors:
1- Materials --(4 materials)
2- Coolants ---(3 coolants)
3- Cutting depth --(2 depths <25,50>)
4- Cutting numbers--(2 times <1 cut--2 cuts>)
5- Grit size -- 3 sizes(Fine --Medium --Coarse)

Response ;
1- strength
2- roughness

I run 48 samples using DOE and then run the analysis .I got the result attached but doesn't know which factor is more significant? I don't know how to save imp fie and send it here.


Fit Model(
Y( :Flexural Strength ),
Effects(
:Material,
:Bur Grit Size,
:Coolant Fluid,
:Cutting Depth,
:Number of Cuts,
:Material * :Bur Grit Size,
:Material * :Coolant Fluid,
:Material * :Cutting Depth,
:Material * :Number of Cuts,
:Bur Grit Size * :Coolant Fluid,
:Bur Grit Size * :Cutting Depth,
:Bur Grit Size * :Number of Cuts,
:Coolant Fluid * :Cutting Depth,
:Coolant Fluid * :Number of Cuts,
:Cutting Depth * :Number of Cuts
),
Random Effects( :Whole Plots ),
Personality( Standard Least Squares ),
Method( REML ),
Emphasis( Minimal Report ),
Run(
:Flexural Strength << {Analysis of Variance( 0 ), Lack of Fit( 0 ),
Plot Actual by Predicted( 0 ), Plot Regression( 0 ),
Plot Residual by Predicted( 0 ), Plot Effect Leverage( 0 )}
)
)
 

v9991

Trusted Information Resource
its little bit difficult(almost dangerous) to interpret&draw inference without knowing the product/process!!!! (cause, although data is used for inferences, but it only leads hypothesis!!!...the point is...dont blindly follow the data !!!)

if you could post the design+results(atleast the excel file), we could probably help you out step by step !!! (again, we can only infer from the available data, but this has to be done in more rigorous way, with functional & technical inputs!!!)

having said that, here are few steps...
1. build the model by selecting the appropriate steps, based on half normal plots OR the p-value of the possible models!
2. ANOVA table :- look out for p-value of model & lack of fit (p<0.05), (+ p-value of the above selected terms. there must be specific rationale for inclusion or exclusion of not meeting p<0.05 criteria)
3. Regression table :- parallelly look out for R-Sq values ( esp...Adj & Pred R-Sq not to differ by 0.2 (rule of thumb!!!)
4. look out for regression equation, and the co-effiients reflect the amount of +ve or -ve effect on the response!
5. evaluate the need for augmentation!!!

also, i find following ref to be extremely usefull & relevant..
Analysis of DOE data


hope this helps.
 
Last edited:
S

seasonal

Thank you for your replay .
I attached an excel file to all the data .

Your help is highly appreciated .
 

Attachments

  • 10-23-14 First Group .xlsx
    48.6 KB · Views: 217

Miner

Forum Moderator
Leader
Admin
What does the column entitled Whole Plots signify? Whole plots typically indicate a Split Plot design structure, but your factors do not align with the whole plot numbers. Does this indicate how the design was blocked?
 
S

seasonal

Thank you for your post.
The whole plot means how the design was blocked.
I did each plot in a single day.
Each plot contains 12 different sample with different interaction.

Thank you
 

Miner

Forum Moderator
Leader
Admin
What software are you using? If you have Minitab, I can share my analysis directly.

First, you will have a fully saturated model, which means that you cannot test for every possible interaction. There is no way to test for 3-way and higher interactions, so you must remove them from the model in order to test the block effect, 2-way interactions and main effects.

Next, test for the block effects and remove it from the model, if not significant. Then non-significant 2-way interactions and lastly non-significant main effects.

I attached the interaction plots blow.
 

Attachments

  • Flex Strength.png
    Flex Strength.png
    18.3 KB · Views: 181
  • Rough Long.png
    Rough Long.png
    20.6 KB · Views: 161
  • Rough Tran.png
    Rough Tran.png
    20 KB · Views: 176
S

seasonal

Thank you for your answers.
I use JMP to do the analysis . `Do you suggest to download Minitab?

Thanks
 

Miner

Forum Moderator
Leader
Admin
No. If it was one that I was familiar with, I could tailor my response to the software.
 
S

seasonal

I downloaded Minitab and start doing some analysis but for now I couldn't have the same results I got from JMP !!
I don't know why .. May I did something wrong .
 

Miner

Forum Moderator
Leader
Admin
I am attaching my project file for reference.
 

Attachments

  • ELSMAR DOE.MPJ
    611 KB · Views: 139
Thread starter Similar threads Forum Replies Date
R Custom DOE (Design of Experiments) Analysis in JMP Quality Tools, Improvement and Analysis 11
A Shainin vs. Fisher vs. Taguchi DOE (Design of Experiments) Statistical Analysis Quality Tools, Improvement and Analysis 10
V Analysis of DOE Results and Model Finalization Using Minitab Software 4
H Minitab DOE Analysis of Data and Transforming Using Minitab Software 4
J DOE Analysis Experiment, 5 factors, 4 factors having 3 levels, and 1 factor having 5 Using Minitab Software 38
B Analyze 'Factorial Design' or 'Variability' - Difference when used for DOE Analysis? Using Minitab Software 1
T Taguchi DOE Analysis - What S/N ratio (Nominal is best or smaller is better) to use? Quality Tools, Improvement and Analysis 5
V Identifying Significant Factors - Regression Analysis vs Correlation vs ANOVA vs DOE Quality Tools, Improvement and Analysis 7
T Any recommendation on DOE/Statistical Analysis Software? Statistical Analysis Tools, Techniques and SPC 1
S Asterisk in DOE minitab software Using Minitab Software 23
J Selecting factors for screening DoE design Statistical Analysis Tools, Techniques and SPC 8
J Including Repeats in DoE using Minitab Using Minitab Software 5
J DoE - Number of runs in Plackett-Burman (Minitab) Using Minitab Software 2
J DoE (Design of Experiments) - Multiple responses with different factors Using Minitab Software 4
K Power point training slides on DOE (Design of Experiments) Wanted Training - Internal, External, Online and Distance Learning 2
I DOE: High variance and small effects in Minitab Using Minitab Software 1
M I have 3 different factors - DOE help Statistical Analysis Tools, Techniques and SPC 3
N Do I need to approach galvanized steel sheet flatness issue with DOE? Problem Solving, Root Cause Fault and Failure Analysis 9
V Screening DOE with 7 Input factors and 4 responses - Significant factors Using Minitab Software 1
H Taguchi mixed model DoE [L16 (4^3 2^6): factors interaction and ANOVA calculation Using Minitab Software 3
R Is there any Excel .xls Spreadsheet available for DOE with 3 factors? Six Sigma 1
N DOE (design of experiments) in Minitab 16 Using Minitab Software 6
D Interpretation of DOE interaction plot Using Minitab Software 8
D Minitab - Design combinations (DOE) Using Minitab Software 4
C DOE - How to determine optimal settings and transposing data Statistical Analysis Tools, Techniques and SPC 2
N 3 factor - 3 level experiment with DoE and Minitab Using Minitab Software 10
M DOE: Significant factor or not Using Minitab Software 2
P When can we apply DOE (Design of Experiments)? Six Sigma 8
R [Minitab] DOE Output vs. Actual Data Using Minitab Software 6
S Blocking In a DOE Six Sigma 1
P Screening DOE: A coming up headache story Quality Tools, Improvement and Analysis 4
Y Please help me solve a DOE problem - New Minitab User Using Minitab Software 36
P Cyclic Effect Factoring in DOE (Design of Experiments) Quality Tools, Improvement and Analysis 1
V Analysing Results after DOE Using Minitab Software 1
J How to Estimate the Number of Replicates on a DOE (Design of Experiments) Six Sigma 5
R 4 Factors 3 Level DOE to determine which factors are significant Using Minitab Software 2
K Minitab Lack-of-Fit Test in DOE (Design of Experiments) Using Minitab Software 4
M Injection Moulding Minitab DOE - All P Values are 0 Using Minitab Software 7
G Setting up a 3 Factor, 2 Level,2 response DOE in Minitab Using Minitab Software 7
Z A DOE in Minitab - 3 factors and 3 levels for each factor Using Minitab Software 12
M Taguchi L4 Orthogonal Array Design of Experiments (DOE) in an Excel spreadsheet Excel .xls Spreadsheet Templates and Tools 3
V Linking the FMEA Causes & Action Plan with DOE Experiments or Experimentation Design FMEA and Control Plans 1
B DOE Question: 3 factors with 2 levels and 1 factor with 3 levels Six Sigma 2
Z Help with running 3 factor DOE factor optimization Using Minitab Software 2
P Help Setting Up and Analyzing 3 Factor 2 Level Full Factorial Design for DOE Using Minitab Software 3
B Taguchi DOE (Design of Experiments) example using Minitab Using Minitab Software 3
C 3 Factor DOE (Design of Experiments) Template Document Control Systems, Procedures, Forms and Templates 0
P How to analyze DOE: 2 Factor, 4 Level Experiment Six Sigma 7
L DOE (Design of Experiments) suggestions Using Minitab Software 7
L DOE (Design of Experiments) - Analyse Variation with Minitab Using Minitab Software 5

Similar threads

Top Bottom