R chart from ANOVA gage R&R test

abichou

Starting to get Involved
This implies that your process variation (ndc=50) is much greater than your tolerance (%Tol=36.5). Is your tolerance input correctly? The parts do not appear to represent actual process variation (increasing trend) unless you have significant tool wear.

The output shows that you have problems with both repeatability and reproducibility. Breaking down reproducibility, you have problems with the operator/part interaction, which means that some operators have problems measuring specific parts.
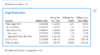
Thank you for you explanation it’s helpful but i still don’t get this one .

Also can i get your opnion on every graph just to get a general idea on how a experienced person thinks analysing wise.
 

abichou

Starting to get Involved
Hi everyone,

I couldn't figure out why exacty the Tolerence values in this table are so high any suggestion maybe?
 

Attachments

  • R chart from ANOVA gage R&R test
    Capture1.PNG
    12.8 KB · Views: 8

Welshwizard

Involved In Discussions
Hello abichou,

Based upon what you have read here why do you think its high? Perhaps you could sum up what you have learnt so far about your study based upon what you have read here.

There is a lot of reading material both here and elsewhere which you clearly need to do. My advice to you is to study and read all you can about the principles of these types of studies because in the end it will be you making the decisions on the outcomes.

Good luck with your journey.
 
Top Bottom