Minitab - Factor Analysis: Label on second series of data for Biplot

S

StacyG

Hello!

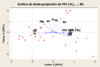
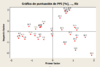
I am using the factor analysis of Minitab and I have two series of data. I obtained a double projection graphic, but I can't add the labels of my second type data (red point). It doesn't appear when I click right on the symbols (whereas I can do it on the punctuation graphic).

Could you help me? Thanks
 

Attachments

  • minitab_pb.PNG
    minitab_pb.PNG
    16.1 KB · Views: 255

Miner

Forum Moderator
Leader
Admin
The graph you attached is called a Biplot. It is an overlay of the loading plot over the score plot. The loading plot shows how each variable "loads" on the first two factors extracted in the analysis. Each variable has a column name that can be used as a label. However the score plot plots the scores for each row of data. The rows do not have names that could be used as labels.
 
S

StacyG

Hello Miner,
I understand, but what I don't understand is why I can add the labels of the red points in the attached figure (minitab-pb2) and not the Biplot (minilab_pb). I may have already responded to this question but I want to be sure about the answer,

Thank you.
 

Attachments

  • minitab_pb2.PNG
    minitab_pb2.PNG
    8.5 KB · Views: 242

Miner

Forum Moderator
Leader
Admin
I am afraid that you will have to ask Minitab that question. I looked and the option to add labels on the biplot simply does not exist. I can speculate that it might be due to the complexity of merging the two graphs or the desire to prevent graph clutter, but those are simply guesses.
 
Top Bottom