I have not seen the new book. Do they show an example?I like this and I understood it, but please have a look for the process in the new booklet. This looks very strange for me.

You are using an out of date browser. It may not display this or other websites correctly.
You should upgrade or use an alternative browser.
You should upgrade or use an alternative browser.
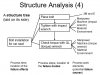
Example of a P-Diagram for Process FMEA - Uncontrollable noises
- Thread starter Jimmy123
- Start date
Bill Levinson
Industrial Statistician and Trainer
Figure 3.3-1 of the AIAG/VDA manual (2019), page 91, has a parameter diagram for a press in sintered bearing. There is a list of process noise factors from work elements: Manpower, Machine, Material, and Environment. (We can potentially add Method and Measurement where applicable.) It also lists the product requirements, and impacted or changed product characteristic (e.g. due to the noise factors). It has other information as well but I think the key is identification of the potential noise factors, which could become failure causes in the failure analysis.
I can't upload the AIAG figure as it is copyrighted but here is one ( (c) Bill Levinson) I made myself for a webinar on FMEA. It relies on a case study from Shigeo Shingo's Zero Quality Control. Shingo did not do an FMEA, but he described error proofing controls for an issue in which the worker could forget to check the torque. From the notes on a previous slide: "Shingo, Shigeo. 1986. Zero Quality Control: Source Inspection and the Poka-Yoke System. Productivity Press Example 78, p. 224. The worker is supposed to check the bolt torque with the torque wrench, and failure to do so depended on worker vigilance. As soon as we see "worker vigilance" (administrative control) in a Shigeo Shingo case study, we know that errors and omissions are going to happen because administrative controls that rely on worker vigilance are rarely if ever capable of making mistakes impossible."
My figure does not have all or even most of the elements of the AIAG parameter diagram (and it is not intended to be one) but it does include the work elements that could conceivably become failure causes.
Attachments
Last edited:
Jimmy123
Involved In Discussions
Your example describes step 2 structure analysis, but not step 3 function analysis where the P-Diagram comes into the game. Develop your example. What are the noises for variation of the output? Think about strength and stress noiseFigure 3.3-1 of the AIAG/VDA manual (2019), page 91, has a parameter diagram for a press in sintered bearing. There is a list of process noise factors from work elements: Manpower, Machine, Material, and Environment. (We can potentially add Method and Measurement where applicable.) It also lists the product requirements, and impacted or changed product characteristic (e.g. due to the noise factors). It has other information as well but I think the key is identification of the potential noise factors, which could become failure causes in the failure analysis.
I can't upload the AIAG figure as it is copyrighted but here is one ( (c) Bill Levinson) I made myself for a webinar on FMEA. It relies on a case study from Shigeo Shingo's Zero Quality Control. Shingo did not do an FMEA, but he described error proofing controls for an issue in which the worker could forget to check the torque. From the notes on a previous slide: "Shingo, Shigeo. 1986. Zero Quality Control: Source Inspection and the Poka-Yoke System. Productivity Press Example 78, p. 224. The worker is supposed to check the bolt torque with the torque wrench, and failure to do so depended on worker vigilance. As soon as we see "worker vigilance" (administrative control) in a Shigeo Shingo case study, we know that errors and omissions are going to happen because administrative controls that rely on worker vigilance are rarely if ever capable of making mistakes impossible."
My figure does not have all or even most of the elements of the AIAG parameter diagram (and it is not intended to be one) but it does include the work elements that could conceivably become failure causes.
like Miners picture. The Intention of the P-Diagram is to think about reasons of variation of the output result inside a tolerance range, not reasons for potential failures outside of the tolerance range. In such a case we can use the Ishikawa diagram. The Intension of different tools are different. Don‘t mix it up, please!
Bill Levinson
Industrial Statistician and Trainer
Your example describes step 2 structure analysis, but not step 3 function analysis where the P-Diagram comes into the game. Develop your example. What are the noises for variation of the output? Think about strength and stress noise
like Miners picture. The Intention of the P-Diagram is to think about reasons of variation of the output result inside a tolerance range, not reasons for potential failures outside of the tolerance range. In such a case we can use the Ishikawa diagram. The Intension of different tools are different. Don‘t mix it up, please!
My example is based on the issue of the worker forgetting a step, as opposed to strength and stress noise. (You are right, by the way, that the parameter diagram goes with function analysis but the structure analysis includes identification of the work elements.) The AIAG failure analysis example, incidentally, asks whether the worker can use the wrong part, load a part incorrectly, or use the wrong material. This would indeed be a potential failure outside the tolerance range, and an assignable cause in the bargain; one probably preventable by error proofing.
Design might involve more attention to the issues you ranged. An example might involve a cyclic stress that might cause a perfectly good part to eventually fail. In PFMEA, we must however consider anything that might generate scrap or rework.
Jimmy123
Involved In Discussions
Dear Miner, I like your picture. Is there a source to name, if I use this in my company?
For some clarification, if I may, the idea of "NOISE" does, in fact, come from Dr. Taguchi and his Two-Step Optimization approach. However, the P-Diagram comes not from Taguchi, but from the field of Robust Engineering. The P-Diagram was introduced by Madhav S. Phadke in his 1989 book, "Quality Engineering Using Robust Design." Phadke was with AT&T Bell Labs. I think of further interest here is the approach Ford Motor Co. introduced, REDPr (known as "Red Pepper") which was short for the Robust Engineering Design Process. REDPr used the P-Diagram as a foundation to introduce the noise-factors as the basis for a quite thorough analysis of the these factors and not just THAT they were related to the Error States (failures) but HOW they were related and if you actually had adequate test coverage to VERIFY your design was robust to these factors (Robustness Checklist or RCL). The P-Diagram is only the beginning if you want to make it really contribute to an increased Value-Add analysis and not play off as just another pretty picture.
That said, I have studied and applied the P-Diagrams for many years within Product Design Engineering. I have been waiting for someone to come up with a meaningful way to use them on the PFMEA side. Alas, I haven't figured it out nor have I seen anyone else's solution that indicates it can bring value to the PFMEA yet...
That said, I have studied and applied the P-Diagrams for many years within Product Design Engineering. I have been waiting for someone to come up with a meaningful way to use them on the PFMEA side. Alas, I haven't figured it out nor have I seen anyone else's solution that indicates it can bring value to the PFMEA yet...
Last edited by a moderator:
Sure it can.

- Piece to Piece variation - lack of capability is a risk
- Changes over life - while tooling wear may be obvious, there are other forms of wear on the machinery that are not as obvious
- Internal Environment - some processes impact other processes downstream, or can impact a characteristic done upstream
- External environment - storage and processing conditions may have a huge impact on quality
Sure it can.
Many of these items can easily be overlooked when doing the typical PFMEA. The P-diagram forces you to consider them.
- Piece to Piece variation - lack of capability is a risk
- Changes over life - while tooling wear may be obvious, there are other forms of wear on the machinery that are not as obvious
- Internal Environment - some processes impact other processes downstream, or can impact a characteristic done upstream
- External environment - storage and processing conditions may have a huge impact on quality
View attachment 26814
Miner,
I agree that these are certainly causes that must be addressed. They are within what I would consider to be a standard PFMEA which bring these to bear through consideration of the Ishikawa "M's". I would consider your examples to be "within" the sphere of control. The NOISE FACTORS are, by definition, intended to be impossible or extremely difficult to control and they require special consideration to figure out how we should address our design (or process in this case) to ensure our robustness to them. So, in the end, does the P-Diagram really add value here or is it just another way to show the Ishikawa "M's" under a new name? Or, as my mentor used to challenge me with, "is it better?....or just different?"
Jimmy123
Involved In Discussions
You are right. The AIAG/VDA booklet show a P-Diagram where the Noise factors are the 5M of Ishikawa. This scope is wrong in my opinion and double work without any value add. The scope from Miner is slightly different and can add value, if it is used in the right way. I agree, that no process engineer in our company have used or tried to use that.Miner,
I agree that these are certainly causes that must be addressed. They are within what I would consider to be a standard PFMEA which bring these to bear through consideration of the Ishikawa "M's". I would consider your examples to be "within" the sphere of control. The NOISE FACTORS are, by definition, intended to be impossible or extremely difficult to control and they require special consideration to figure out how we should address our design (or process in this case) to ensure our robustness to them. So, in the end, does the P-Diagram really add value here or is it just another way to show the Ishikawa "M's" under a new name? Or, as my mentor used to challenge me with, "is it better?....or just different?"
Similar threads
- Replies
- 9
- Views
- 1K
- Replies
- 7
- Views
- 586
- Replies
- 12
- Views
- 335