Taguchi Minitab - Continuous Data - What should I choose as response variable?

A

akzmn

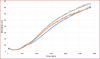
Hi… I am working on an unconventional method to measure electrical resistivity of a material over time… There are three controllable variables (frequency, voltage, wave form) and I have chosen 3 levels for each (for example voltage could be 2V,5V, or 8V)…You can see an example of measurements (repeated 3 times under same test conditions) during 48 hours (attached pic)… I want to use Taguchi method to find the test conditions which leads to the minimum variations in resistivity readings (the resistivity value itself is not that important as the device will be calibrated, but I need to reach the highest repeatability) ….So now the question is: what should I choose as response variable (since readings are continuous)? I need a measure to show the variations over 48-hour time so I cannot use the resistivity in a single time point…thanks in advance!
 

Attachments

  • Picture1.png
    Picture1.png
    25.3 KB · Views: 239

Miner

Forum Moderator
Leader
Admin
I will start off with questioning why you want to use a Taguchi approach versus other techniques. If it is strictly because you want to minimize the variation, I can recommend some better approaches.

First, I would start with a 2^3 full factorial with center points. Take repeat measurements for each experimental run and calculate the mean and standard deviation of the repeat measurements. Then analyze the means and standard deviations separately. This will identify which factors affect the mean, which the standard deviation, which affect both or neither.

The center point will identify whether curvature exists. If it does, and is important to know, you can add axial points to the existing experiment and convert it into a response surface. Taguchi's S/N ratio just confuses things by combining different measures into a single value.

Now to your actual question, are you trying to minimize the spread between the three plots? If so, can you integrate the area between the plots? Or approximate it by calculating a delta at defined increments and totaling these deltas? If you minimize this area, you would improve the repeatability.
 
A

akzmn

I will start off with questioning why you want to use a Taguchi approach versus other techniques. If it is strictly because you want to minimize the variation, I can recommend some better approaches.

First, I would start with a 2^3 full factorial with center points. Take repeat measurements for each experimental run and calculate the mean and standard deviation of the repeat measurements. Then analyze the means and standard deviations separately. This will identify which factors affect the mean, which the standard deviation, which affect both or neither.

The center point will identify whether curvature exists. If it does, and is important to know, you can add axial points to the existing experiment and convert it into a response surface. Taguchi's S/N ratio just confuses things by combining different measures into a single value.

Now to your actual question, are you trying to minimize the spread between the three plots? If so, can you integrate the area between the plots? Or approximate it by calculating a delta at defined increments and totaling these deltas? If you minimize this area, you would improve the repeatability.
Thank you Miner for the explanation... I just thought Taguchi could help me get the optimum test conditions easier, but after reading your post it does not seem so... Yes I am trying to minimize the spread bw the three plots (i.e. improve repeatability of test) .. Just to make sure I got your point right: by "2^3 full factorial with center points" you mean having two factors in moderate level (assuming each factor could be set to HIGH, MODERATE, or LOW) and changing the other factor and then analyzing mean and SD, is that right?
 
Last edited by a moderator:

Miner

Forum Moderator
Leader
Admin
Thank you Miner for the explanation... I just thought Taguchi could help me get the optimum test conditions easier, but after reading your post it does not seem so... Yes I am trying to minimize the spread bw the three plots (i.e. improve repeatability of test) .. Just to make sure I got your point right: by "2^3 full factorial with center points" you mean having two factors in moderate level (assuming each factor could be set to HIGH, MODERATE, or LOW) and changing the other factor and then analyzing mean and SD, is that right?

No. 2^3 notation means 3 factors at 2 levels (-1 = low, +1 = high). The center point sets all 3 factors simultaneously at the middle (0) level, allowing you to determine whether curvature exists. A full factorial (2^3 = 2 x 2 x 2 = 8 runs) + 1 centerpoint = 9 total runs. Run repeated tests for each of the 9 runs. You will end up with 9 means and 9 standard deviations, which you treat as 2 different responses to analyze.
 
Top Bottom