10.2.5 Warranty Management - Process Measures

Tim.W

Registered
I am the Quality Manager for a Tier 1 supplier to GM. Last August GM updated there CSRs to include a requirement for CQI-14 Automotive Warranty Management. Due to the new and somewhat robust requirement we've opted to define warranty management as its own process. What are some process measures for warranty? Currently we are using IPTV (Incidents per thousand vehicles) but we are unsure how best to calculate this measure. Should the incidents count toward the vehicle built the month the incident was reported, or toward the month the component itself was built? (We are considering vehicles built based on the pieces we sell in a given month).

There are issues with both methods.
Calculating each incident based on month of occurrence means that we will have spikes in weaker sales periods.

Calculating each incident based on the month the component was built means that past months will take a minimum of 18 months to stabilize.
 

Sebastian

Trusted Information Resource
I can't support in selecting right indicator, but I can share my experience in using monitoring methods.
Unfortunately I don't have access to graph, I made in Excel working for previous employer.
I've used data supplied by customer regarding affected vehicle line off dates.
I am not sure now, whether I treated these dates as our part manufacturing dates or move them about 1 month earlier.

Graph curve (reported cases versus line off dates) changed every month, that was not a problem.
Graph curve was "allowed" to grow up, following reporting of next failure cases.
Most important thing was to know whether graph curve is not "moving forward" beyond month field fix part was introduced.
I hope you could imagine what I am talking about.

Considering indicator, maybe I would set target for yearly periods, starting from vehicle SOP date.
Incidents reported versus quantities delivered.
 
Last edited:

Miner

Forum Moderator
Leader
Admin
There are two other methods that I have used:
  1. Use a rolling (X number of months) for your denominator to smooth out the spikes. However, use each months actual (not rolling) for the numerator.
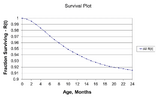
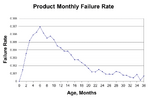
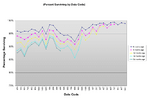
  2. Use a Kaplan-Meier analysis of your method 2. This will provide information such as the graphs shown below. You can also create reliability growth plots.
10.2.5 Warranty Management - Process Measures
 

Sebastian

Trusted Information Resource
Could you tell more about how graphs trigger actions?
E.g. there is horizontal line for Survival plot and when fraction rate goes below it, actions are needed?
 

Miner

Forum Moderator
Leader
Admin
@Sebastian You would have to establish that. I use these graphs analytically to determine whether trends are improving or deteriorating. The second graph shows whether you are in an infant mortality (manufacturing issue), random failure (design issue) or wear out (design issue) phase. The third graph shows if you have problems with a specific manufacturing lot and whether they have been corrected. Our design and process engineers loved that graph.
 

Bev D

Heretical Statistician
Leader
Super Moderator
Attached is a very old presentation I made on the Cumulative frequency chart for warranty trending. (My other presentations have charts from real world situations that are covered by IP…I would have to seriously edit them). The idea is that the X axis is elapsed time since manufacture and the Y axis is the percentage or proportion of claims, returns etc. I used this successfully for automotive and medical devices where my organization sold the finished product to the consumer….
 

Attachments

  • Warranty Cumulative Frequency Chart.ppt
    183.5 KB · Views: 26

Tim.W

Registered
Thank you everyone for your insights into warranty. I will be sharing these principals with my team.
 
Top Bottom