What is the conversion for PPM defects vs. Sigma Equivalents?

S

sixsigmais

Just use the excel formula
=(1-NORMDIST(sigma-1.5,0,1,1))*1000000

Replace the sigma with the number of sigma you like to find.

So, 6 sigma
=(1-NORMDIST(6-1.5,0,1,1))*1000000 = 3.4ppm


5 sigma
=(1-NORMDIST(5-1.5,0,1,1))*1000000 = 233ppm

and so on
 
P

Palt88

Just use the excel formula
=(1-NORMDIST(sigma-1.5,0,1,1))*1000000

Replace the sigma with the number of sigma you like to find.

So, 6 sigma
=(1-NORMDIST(6-1.5,0,1,1))*1000000 = 3.4ppm


5 sigma
=(1-NORMDIST(5-1.5,0,1,1))*1000000 = 233ppm

and so on
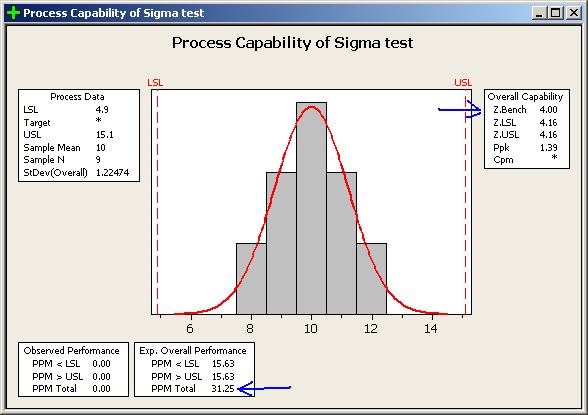
Thanks

But I'm looking for the "unshifted" one...
Usefull anyway!

Do someone got a statistical software (else than minitab) to check what level of total ppm it gives with a sigma level of 4.5 ???
 
A

Al Hector

But I'm looking for the "unshifted" one...
Usefull anyway!

Do someone got a statistical software (else than minitab) to check what level of total ppm it gives with a sigma level of 4.5 ???

I am not very familiar with this subject, but after a quick search I found something that maybe is useful for you : there is a tabel which can be downloaded from the following link :
http://www.adamssixsigma.com/Newsletters/standard_normal_table.htm


Alin
 
S

sixsigmais

Thanks

But I'm looking for the "unshifted" one...
Usefull anyway!

Do someone got a statistical software (else than minitab) to check what level of total ppm it gives with a sigma level of 4.5 ???

Just modify the formula to
=(1-NORMDIST(sigma,0,1,1))*1000000

Then the ppm is "unshifted"
For 4.5 sigma (unshifted), it is 3.4ppm
 
P

Palt88

Thanks both for your support.

Alin, I think there is interesting informations in your link, I will read.


Sixsigmais: Thanks for the formulas. I have also modified the shifted fbut I make the error to multiply the result by 2, which makes me confused.

The unshifted formula gives exactly the same results provided by a statistical software.

But still confused why the ppm level is doubled (excep at 4.5 sigma) in the previous unshifted tables....thing that I'm unable to simulate with a statistical software even with a centered double sided distribution...

sigmay.jpg
 

Tim Folkerts

Trusted Information Resource
The tables seem to be full of mistakes, so don't worry too much about them.

Products can be above spec of below spec. In principle you should calculate the upper and lower tail for every case. However, when one tail is farther from the center than the other, then the far tail can typically be ignored.

Attached is a simple spreadsheet with sigma levels, defects in the close tail, the far tail, and total defects. You can set the shift to see how many defects are in each tail. For SHIFT = 0 you get the traditional values. For SHIFT = 1.5 you get the "Six Sigma" values. Even SHIFT = 0.1 will make the close tail considerably bigger than the far tail.


Tim
 

Attachments

  • Six_Sigma_PPM.xls
    10.5 KB · Views: 558
B

Bheemaraj

Please see attached six sigma spreadsheets. Sigma to ppm worksheet (PPM). Create your own chart by typing in numbers.
 

Attachments

  • Six Sigma Template Kit.xls
    287 KB · Views: 621
  • SigmaCalculator.xls
    17.5 KB · Views: 439
G

GManikandan

Re: Thank you all.

I'm thoroughly impressed. I've looked for this conversion on and off over the years. I even asked a professor from a college in Dayton and he could only quote the emperical rule. Thank you for your help. I only hope that I can help someone else someday.

Totumfrog
Hello Tm Folkerts, D.Scott, Totumfrog,

Can you please post the Z table which you have used in the above explanation?

Thanks
G.Manikandan
 
Top Bottom